Texas A&M International University total enrollment is approximately 8,525 students. 5,512 are undergraduates and 428 are graduate students.
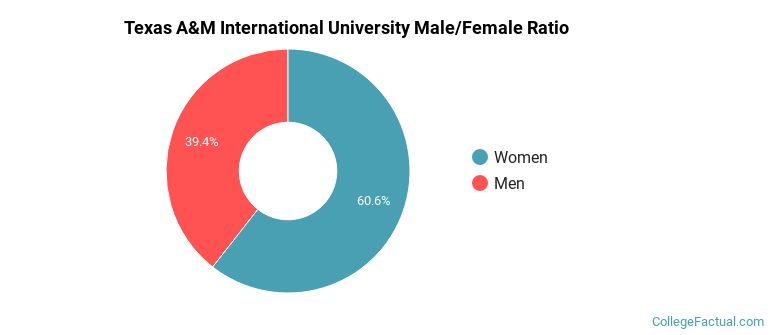
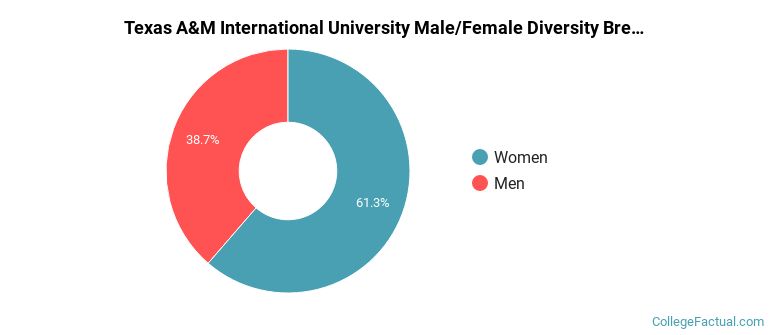
Male/Female Breakdown of Undergraduates
The full-time Texas A&M International University undergraduate population is made up of 62% women, and 38% men.
For the gender breakdown for all students, go here.
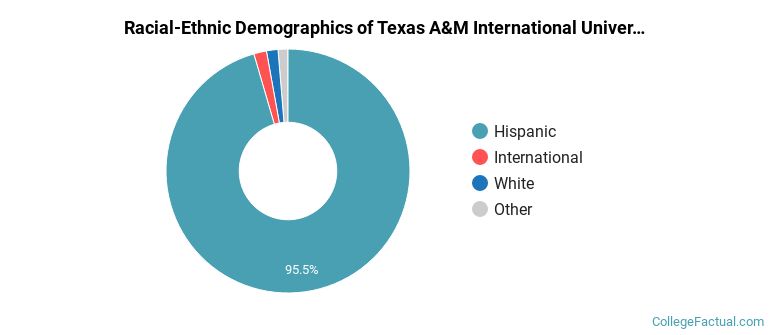
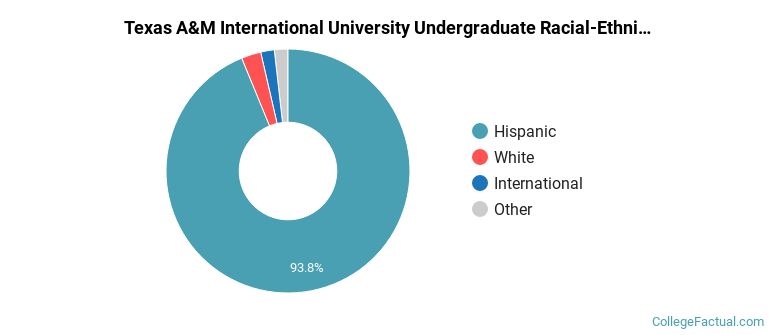
Texas A&M International University Racial/Ethnic Breakdown of Undergraduates
| Race/Ethnicity | Number |
|---|---|
| Hispanic | 5,250 |
| White | 103 |
| International | 78 |
| Black or African American | 36 |
| Asian | 16 |
| Multi-Ethnic | 13 |
| Unknown | 13 |
| Native Hawaiian or Pacific Islander | 0 |
See racial/ethnic breakdown for all students.
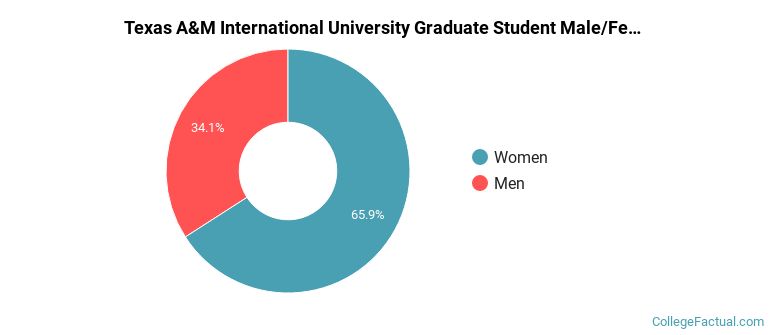
Male/Female Breakdown of Graduate Students
About 67% of full-time grad students are women, and 33% men.
For the gender breakdown for all students, go here.
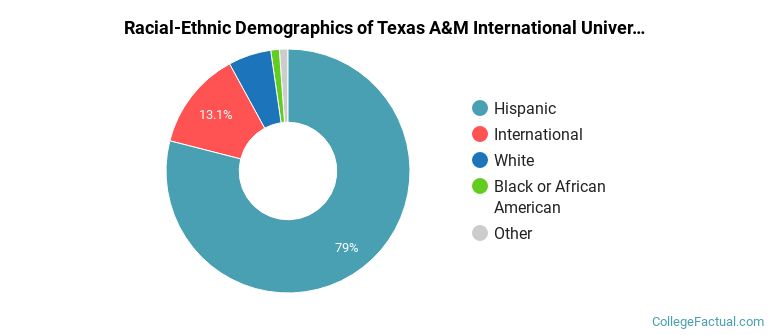
Texas A&M International University Racial-Ethnic Breakdown of Graduate Students
| Race/Ethnicity | Number |
|---|---|
| Hispanic | 306 |
| White | 77 |
| International | 20 |
| Black or African American | 11 |
| Asian | 9 |
| Multi-Ethnic | 4 |
| Unknown | 1 |
| Native Hawaiian or Pacific Islander | 0 |
See racial/ethnic breakdown for all students.
| Race/Ethnicity | Number |
|---|---|
| Hispanic | 7,793 |
| White | 384 |
| International | 125 |
| Black or African American | 94 |
| Asian | 60 |
| Unknown | 35 |
| Multi-Ethnic | 29 |
| Native Hawaiian or Pacific Islander | 1 |
There are approximately 5,249 female students and 3,276 male students at Texas A&M International University.
Texas A&M International University ranks 1,905 out of 2,183 when it comes to geographic diversity.
0.45% of Texas A&M International University students come from out of state, and 1.26% come from out of the country.
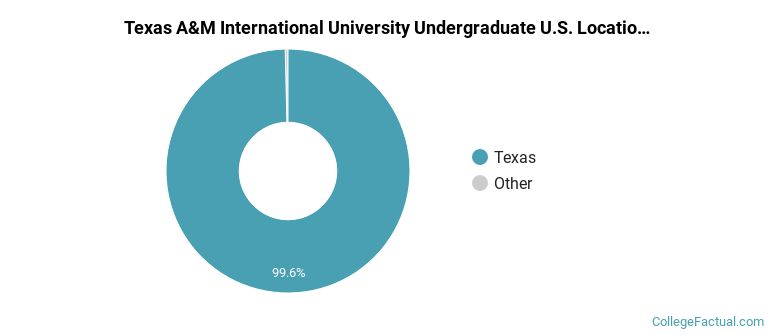
The undergraduate student body is split among 5 states (may include Washington D.C.). Click on the map for more detail.
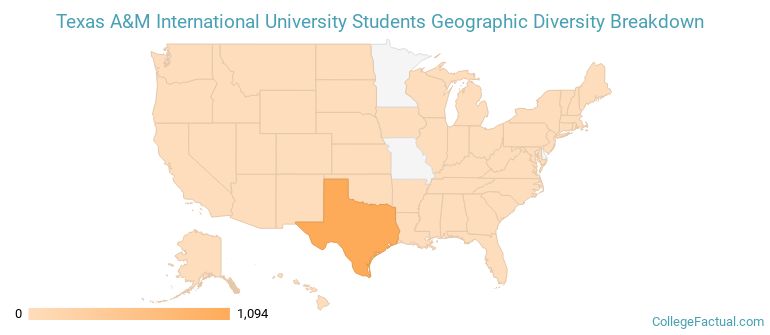
| State | Amount |
|---|---|
| Texas | 1,094 |
| Arkansas | 1 |
| California | 1 |
| Nevada | 1 |
| Tennessee | 1 |
Students from 41 countries are represented at this school, with the majority of the international students coming from Mexico, India, and Nepal.
Learn more about international students at Texas A&M International University.
A traditional college student is defined as being between the ages of 18-21. At Texas A&M International University, 50.35% of students fall into that category, compared to the national average of 60%.
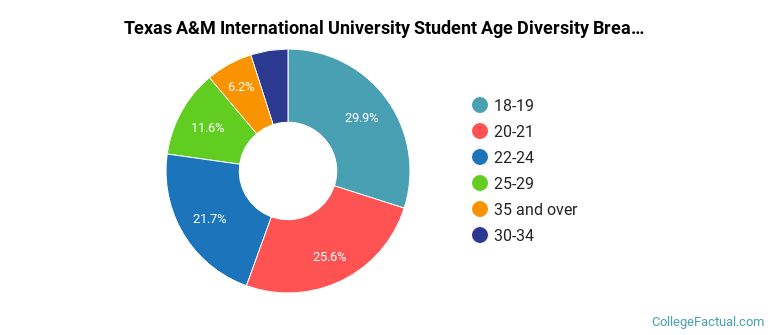
| Student Age Group | Amount |
|---|---|
| 18-19 | 2,073 |
| 20-21 | 1,774 |
| 22-24 | 1,503 |
| 25-29 | 806 |
| 35 and over | 430 |
| 30-34 | 342 |
| Under 18 | 0 |
Footnotes
*The racial-ethnic minorities count is calculated by taking the total number of students and subtracting white students, international students, and students whose race/ethnicity was unknown. This number is then divided by the total number of students at the school to obtain the racial-ethnic minorities percentage.
References