We've pulled together some essential information you should know about the program, including how many students graduate each year, the ethnic diversity of these students, average starting salaries, and more. We've also included details on how Texas A&M College Station ranks compared to other colleges offering a major in architecture.
Go directly to any of the following sections:
In College Factual's most recent rankings for the best schools for architecture majors, Texas A&M College Station came in at #3. This puts it in the top 5% of the country in this field of study. It is also ranked #1 in Texas.
During the 2021-2022 academic year, Texas A&M University - College Station handed out 90 bachelor's degrees in general architecture. This is a decrease of 8% over the previous year when 98 degrees were handed out.
In 2022, 35 students received their master’s degree in architecture from Texas A&M College Station. This makes it the #10 most popular school for architecture master’s degree candidates in the country.
In addition, 9 students received their doctoral degrees in architecture in 2022, making the school the #4 most popular school in the United States for this category of students.
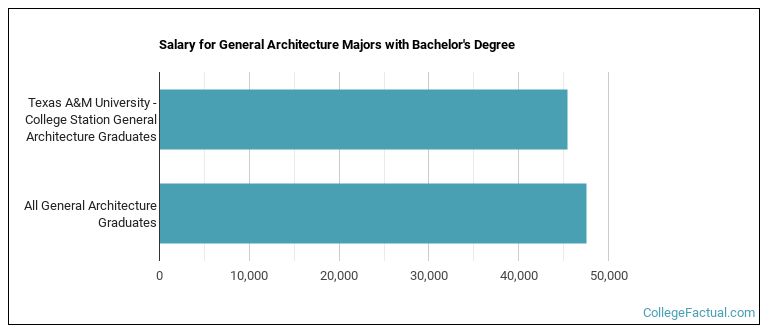
The median salary of architecture students who receive their bachelor's degree at Texas A&M College Station is $45,431. This is less than $47,542, which is the national median of all architecture majors in the nation who earn bachelor's degrees.
The typical student loan payment of a bachelor's degree student from the architecture program at Texas A&M College Station is $414 per month.
Out-of-state part-time undergraduates at Texas A&M College Station paid an average of $1,225 per credit hour in 2022-2023. The average for in-state students was $307 per credit hour. The following table shows the average full-time tuition and fees for undergraduates.
| In State | Out of State | |
|---|---|---|
| Tuition | $9,003 | $36,428 |
| Fees | $3,838 | $3,900 |
| Books and Supplies | $900 | $900 |
| On Campus Room and Board | $13,154 | $13,154 |
| On Campus Other Expenses | $6,354 | $6,354 |
Learn more about Texas A&M College Station tuition and fees.
During the 2021-2022 academic year, 90 architecture majors earned their bachelor's degree from Texas A&M College Station. Of these graduates, 43% were men and 57% were women.

The majority of bachelor's degree recipients in this major at Texas A&M College Station are white. In the most recent graduating class for which data is available, 60% of students fell into this category.
The following table and chart show the ethnic background for students who recently graduated from Texas A&M University - College Station with a bachelor's in architecture.

| Ethnic Background | Number of Students |
|---|---|
| Asian | 3 |
| Black or African American | 2 |
| Hispanic or Latino | 29 |
| White | 54 |
| Non-Resident Aliens | 0 |
| Other Races | 2 |
Online degrees for the Texas A&M College Station architecture bachelor’s degree program are not available at this time. To see if the school offers distance learning options in other areas, visit the Texas A&M College Station Online Learning page.
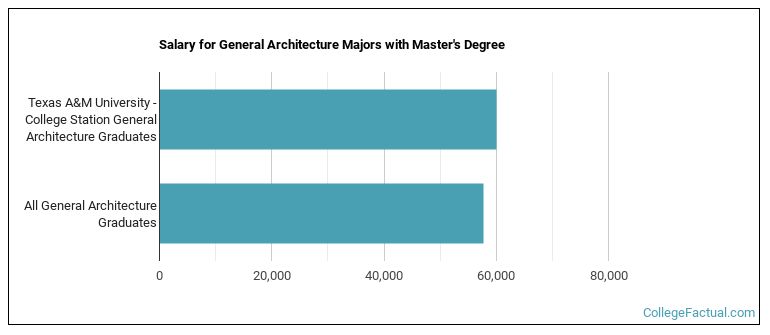
Architecture majors graduating with a master's degree from Texas A&M College Station make a median salary of $60,017 a year. This is a better than average outcome since the median salary for all architecture graduates with a master's is $57,677.
During the 2021-2022 academic year, 27 students graduated with a master's degree in architecture from Texas A&M College Station. About 52% were men and 48% were women.

The majority of the students with this major are white. About 56% of 2022 graduates were in this category.
The following table and chart show the ethnic background for students who recently graduated from Texas A&M University - College Station with a master's in architecture.

| Ethnic Background | Number of Students |
|---|---|
| Asian | 1 |
| Black or African American | 2 |
| Hispanic or Latino | 7 |
| White | 15 |
| Non-Resident Aliens | 1 |
| Other Races | 1 |
Take a look at the following statistics related to the make-up of the architecture majors at Texas A&M University - College Station.
| Related Major | Annual Graduates |
|---|---|
| Urban & Regional Planning | 73 |
| Landscape Architecture | 34 |
| Environmental Design | 7 |
More about our data sources and methodologies.