TSU total enrollment is approximately 7,015 students. 4,204 are undergraduates and 1,306 are graduate students.
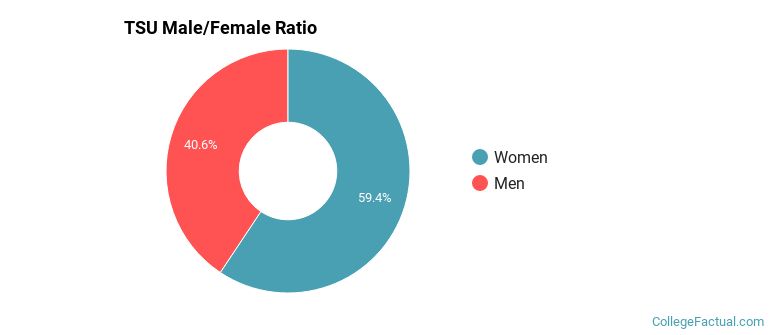
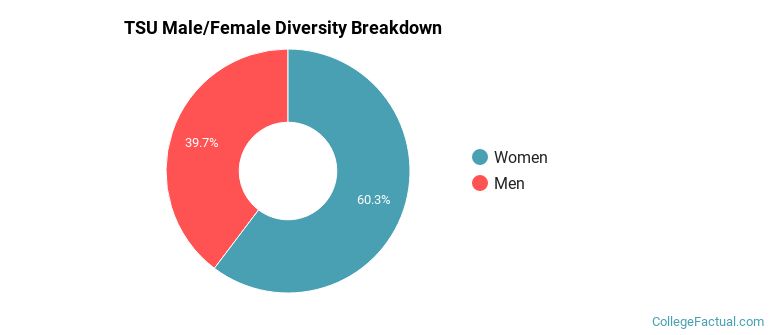
Male/Female Breakdown of Undergraduates
The full-time TSU undergraduate population is made up of 65% women, and 35% men.
For the gender breakdown for all students, go here.
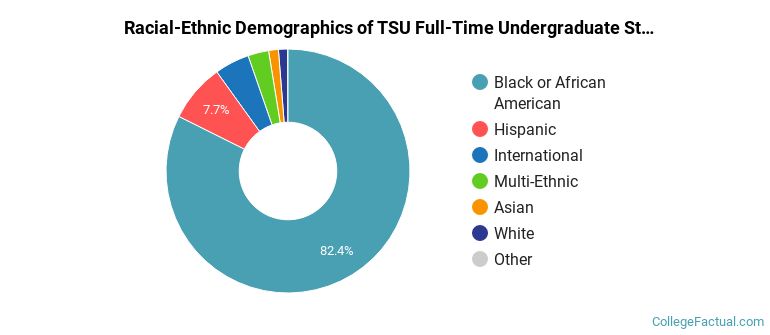
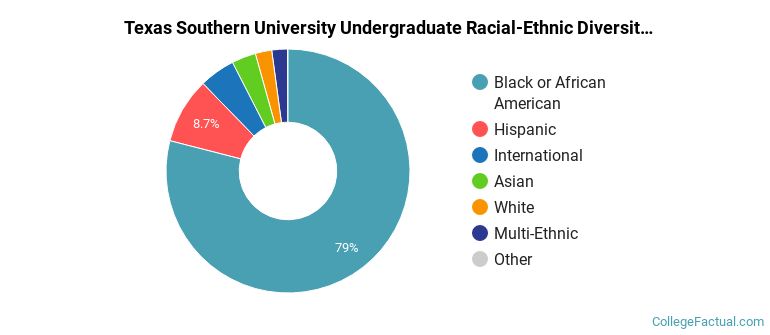
TSU Racial/Ethnic Breakdown of Undergraduates
| Race/Ethnicity | Number |
|---|---|
| Black or African American | 3,483 |
| Hispanic | 344 |
| International | 147 |
| Multi-Ethnic | 120 |
| Asian | 54 |
| White | 53 |
| Native Hawaiian or Pacific Islander | 2 |
| Unknown | 0 |
See racial/ethnic breakdown for all students.
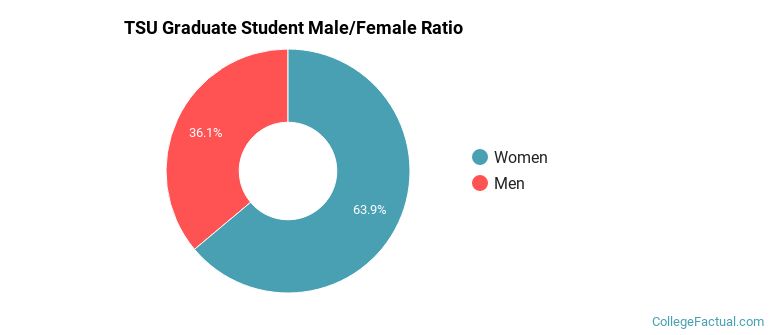
Male/Female Breakdown of Graduate Students
About 65% of full-time grad students are women, and 35% men.
For the gender breakdown for all students, go here.
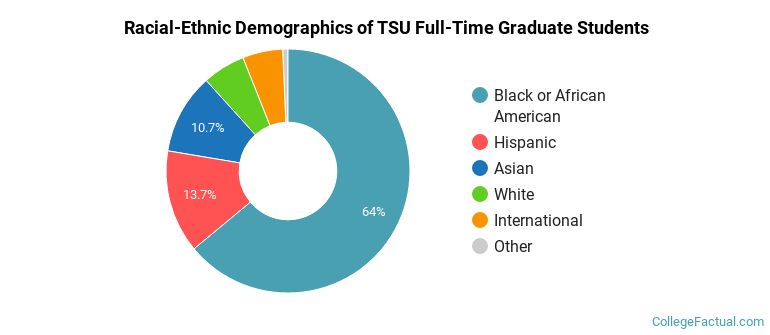
TSU Racial-Ethnic Breakdown of Graduate Students
| Race/Ethnicity | Number |
|---|---|
| Black or African American | 801 |
| Hispanic | 195 |
| Asian | 138 |
| White | 86 |
| International | 63 |
| Multi-Ethnic | 18 |
| Native Hawaiian or Pacific Islander | 0 |
| Unknown | 0 |
See racial/ethnic breakdown for all students.
| Race/Ethnicity | Number |
|---|---|
| Black or African American | 5,522 |
| Hispanic | 659 |
| International | 254 |
| Asian | 245 |
| White | 161 |
| Multi-Ethnic | 158 |
| Native Hawaiian or Pacific Islander | 5 |
| Unknown | 0 |
There are approximately 4,482 female students and 2,533 male students at TSU.
TSU ranks 940 out of 2,183 when it comes to geographic diversity.
14.04% of TSU students come from out of state, and 2.78% come from out of the country.

The undergraduate student body is split among 25 states (may include Washington D.C.). Click on the map for more detail.

| State | Amount |
|---|---|
| Texas | 1,053 |
| Louisiana | 44 |
| California | 27 |
| Illinois | 15 |
| Michigan | 10 |
Students from 59 countries are represented at this school, with the majority of the international students coming from Saudi Arabia, Nigeria, and Kuwait.
Learn more about international students at TSU.
A traditional college student is defined as being between the ages of 18-21. At TSU, 41.33% of students fall into that category, compared to the national average of 60%.

| Student Age Group | Amount |
|---|---|
| 18-19 | 2,461 |
| 22-24 | 2,290 |
| 25-29 | 1,900 |
| 20-21 | 1,770 |
| 35 and over | 1,053 |
| 30-34 | 707 |
| Under 18 | 0 |
Footnotes
*The racial-ethnic minorities count is calculated by taking the total number of students and subtracting white students, international students, and students whose race/ethnicity was unknown. This number is then divided by the total number of students at the school to obtain the racial-ethnic minorities percentage.
References
Department of Homeland Security Citizenship and Immigration Services
Image Credit: By WhisperToMe under License