TTUHSC total enrollment is approximately 5,274 students. 1,163 are undergraduates and 2,669 are graduate students.
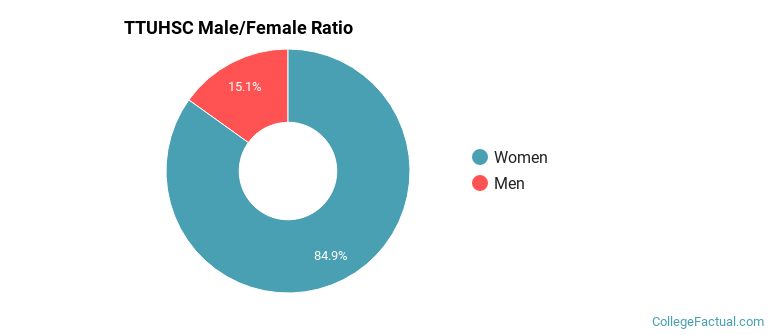
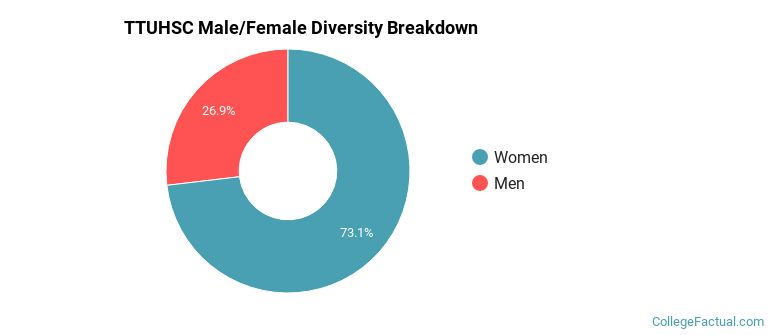
Male/Female Breakdown of Undergraduates
The full-time TTUHSC undergraduate population is made up of 87% women, and 13% men.
For the gender breakdown for all students, go here.
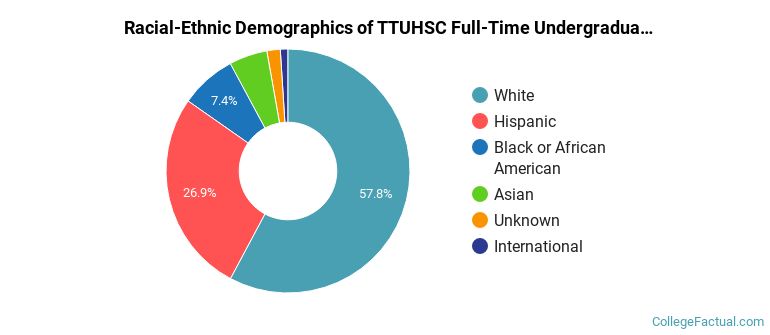
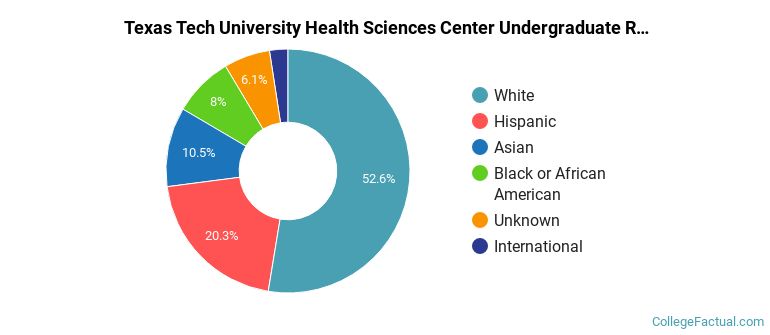
TTUHSC Racial/Ethnic Breakdown of Undergraduates
| Race/Ethnicity | Number |
|---|---|
| White | 642 |
| Hispanic | 312 |
| Black or African American | 109 |
| Asian | 64 |
| International | 6 |
| Unknown | 5 |
| Native Hawaiian or Pacific Islander | 0 |
| Multi-Ethnic | 0 |
See racial/ethnic breakdown for all students.
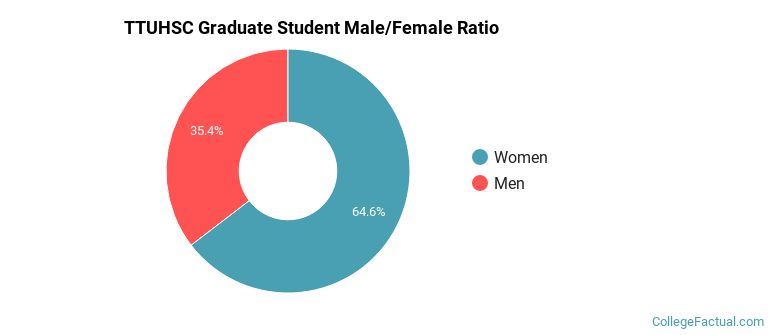
Male/Female Breakdown of Graduate Students
About 67% of full-time grad students are women, and 33% men.
For the gender breakdown for all students, go here.
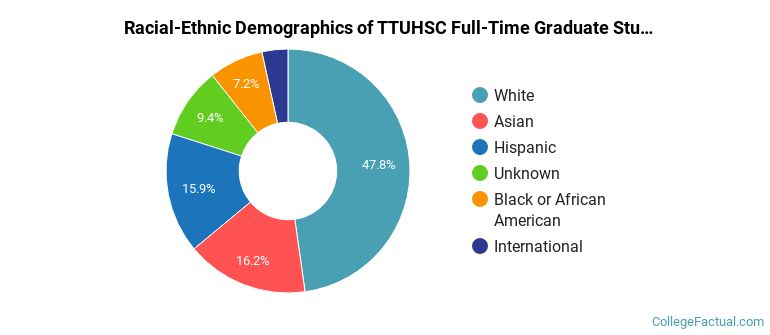
TTUHSC Racial-Ethnic Breakdown of Graduate Students
| Race/Ethnicity | Number |
|---|---|
| White | 1,288 |
| Asian | 483 |
| Hispanic | 474 |
| Black or African American | 240 |
| Unknown | 94 |
| International | 73 |
| Native Hawaiian or Pacific Islander | 0 |
| Multi-Ethnic | 0 |
See racial/ethnic breakdown for all students.
| Race/Ethnicity | Number |
|---|---|
| White | 2,731 |
| Hispanic | 1,130 |
| Asian | 640 |
| Black or African American | 489 |
| Unknown | 141 |
| International | 87 |
| Native Hawaiian or Pacific Islander | 0 |
| Multi-Ethnic | 0 |
There are approximately 3,946 female students and 1,328 male students at TTUHSC.
Learn more about international students at TTUHSC.
A traditional college student is defined as being between the ages of 18-21. At TTUHSC, 6.24% of students fall into that category, compared to the national average of 60%.
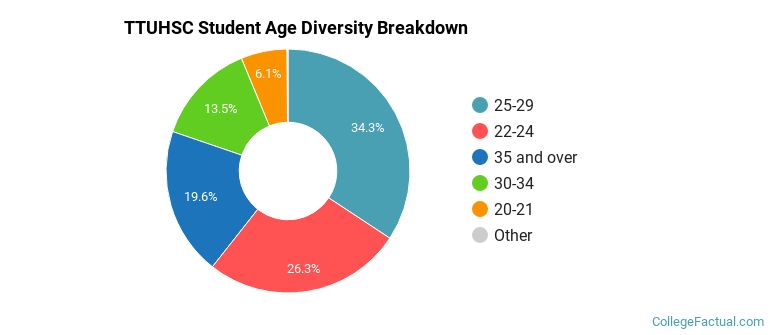
| Student Age Group | Amount |
|---|---|
| 25-29 | 1,867 |
| 22-24 | 1,435 |
| 35 and over | 1,068 |
| 30-34 | 736 |
| 20-21 | 332 |
| 18-19 | 8 |
| Under 18 | 0 |
Footnotes
*The racial-ethnic minorities count is calculated by taking the total number of students and subtracting white students, international students, and students whose race/ethnicity was unknown. This number is then divided by the total number of students at the school to obtain the racial-ethnic minorities percentage.
References
Department of Homeland Security Citizenship and Immigration Services
Image Credit: By Krista Mericle under License
Read College Factual's Diversity Ranking Methodology.