TWU total enrollment is approximately 16,433 students. 6,873 are undergraduates and 2,374 are graduate students.
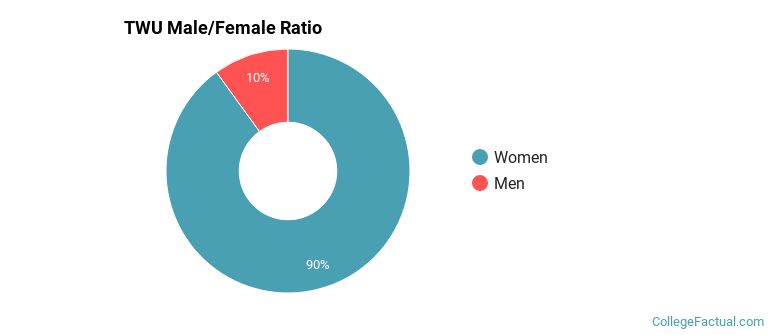
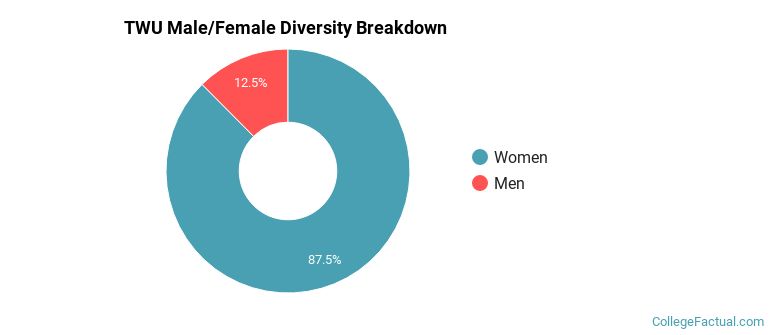
Male/Female Breakdown of Undergraduates
The full-time TWU undergraduate population is made up of 91% women, and 9% men.
For the gender breakdown for all students, go here.
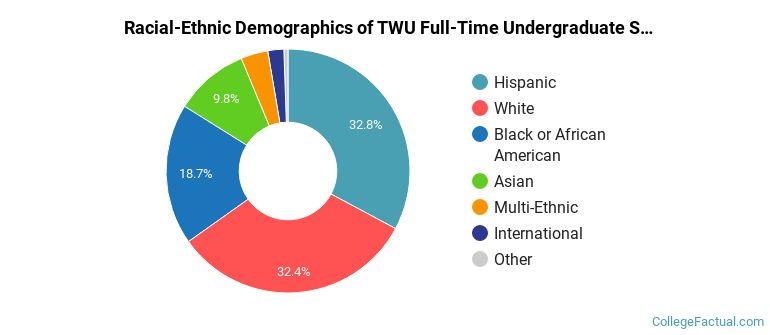
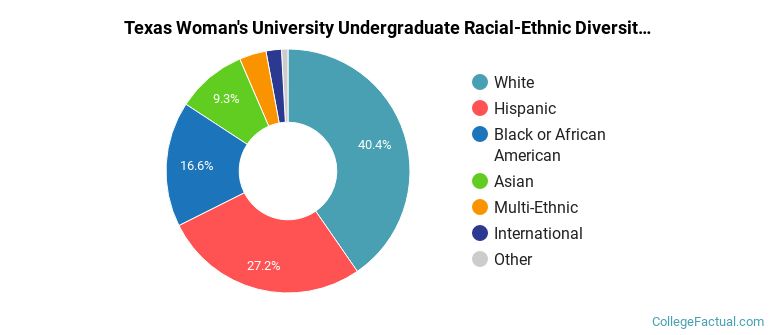
TWU Racial/Ethnic Breakdown of Undergraduates
| Race/Ethnicity | Number |
|---|---|
| Hispanic | 2,270 |
| White | 2,121 |
| Black or African American | 1,282 |
| Asian | 678 |
| Multi-Ethnic | 266 |
| International | 202 |
| Unknown | 29 |
| Native Hawaiian or Pacific Islander | 5 |
See racial/ethnic breakdown for all students.
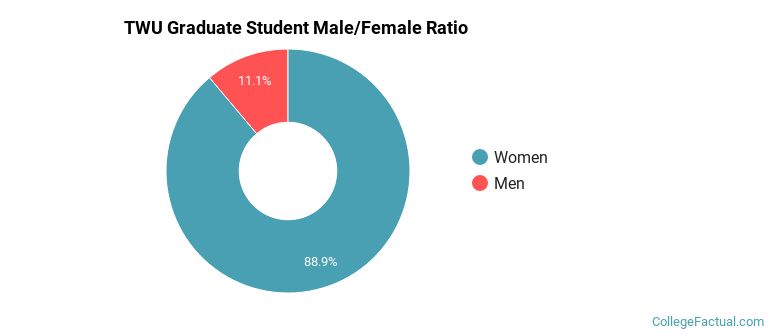
Male/Female Breakdown of Graduate Students
About 89% of full-time grad students are women, and 11% men.
For the gender breakdown for all students, go here.
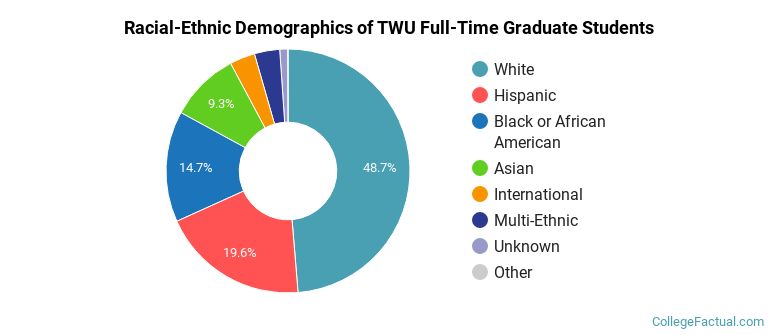
TWU Racial-Ethnic Breakdown of Graduate Students
| Race/Ethnicity | Number |
|---|---|
| White | 1,134 |
| Hispanic | 499 |
| Black or African American | 355 |
| Asian | 218 |
| Multi-Ethnic | 77 |
| International | 69 |
| Unknown | 17 |
| Native Hawaiian or Pacific Islander | 1 |
See racial/ethnic breakdown for all students.
| Race/Ethnicity | Number |
|---|---|
| White | 6,485 |
| Hispanic | 4,530 |
| Black or African American | 2,742 |
| Asian | 1,543 |
| Multi-Ethnic | 594 |
| International | 381 |
| Unknown | 107 |
| Native Hawaiian or Pacific Islander | 8 |
There are approximately 14,411 female students and 2,022 male students at TWU.
TWU ranks 1,804 out of 2,183 when it comes to geographic diversity.
1.18% of TWU students come from out of state, and 0.38% come from out of the country.
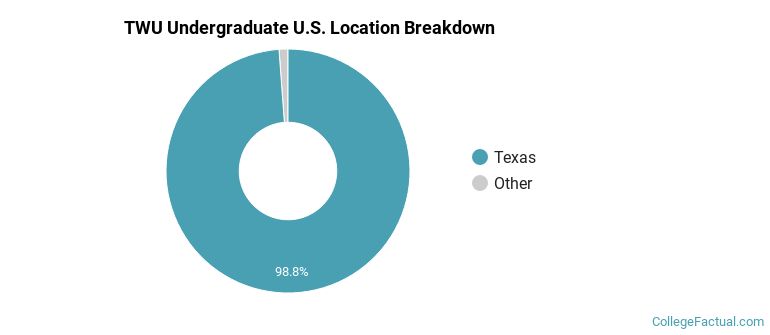
The undergraduate student body is split among 11 states (may include Washington D.C.). Click on the map for more detail.
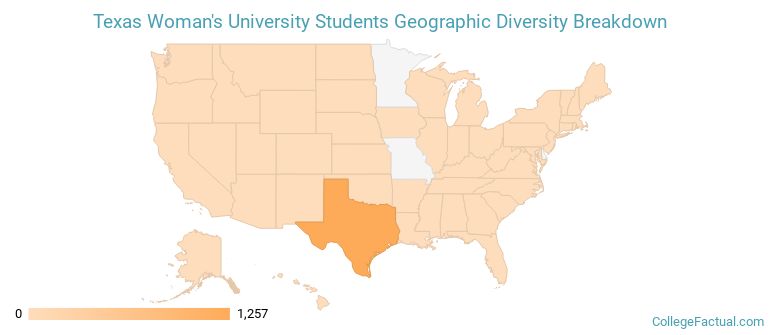
| State | Amount |
|---|---|
| Texas | 1,257 |
| Washington | 3 |
| Kansas | 2 |
| Oklahoma | 2 |
| Tennessee | 2 |
Students from 56 countries are represented at this school, with the majority of the international students coming from India, South Korea, and Vietnam.
Learn more about international students at TWU.
A traditional college student is defined as being between the ages of 18-21. At TWU, 30.91% of students fall into that category, compared to the national average of 60%.
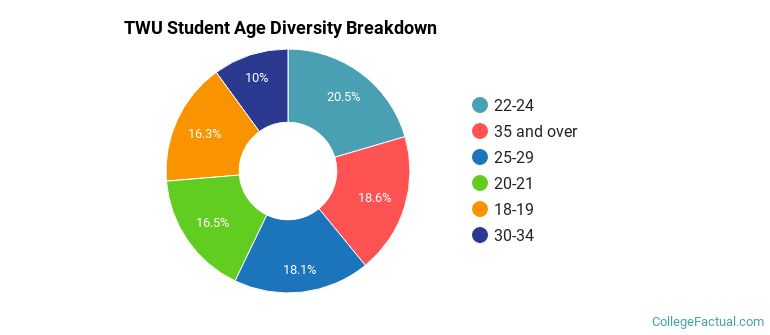
| Student Age Group | Amount |
|---|---|
| 22-24 | 2,978 |
| 35 and over | 2,711 |
| 25-29 | 2,631 |
| 20-21 | 2,408 |
| 18-19 | 2,375 |
| 30-34 | 1,458 |
| Under 18 | 0 |
Footnotes
*The racial-ethnic minorities count is calculated by taking the total number of students and subtracting white students, international students, and students whose race/ethnicity was unknown. This number is then divided by the total number of students at the school to obtain the racial-ethnic minorities percentage.
References
Department of Homeland Security Citizenship and Immigration Services
Image Credit: By Michael Barera under License
Read College Factual's Diversity Ranking Methodology.