Here, you'll find out more about the major, including such details as the number of graduates, what degree levels are offered, ethnicity of students, average salaries, and more. We've also included details on how UA ranks compared to other colleges offering a major in biology.
Go directly to any of the following sections:
The bachelor's program at UA was ranked #139 on College Factual's Best Schools for biology list. It is also ranked #3 in Alabama.
| Ranking Type | Rank |
|---|---|
| Best General Biology Master’s Degree Schools | 61 |
| Best General Biology Graduate Degree Schools | 84 |
| Best General Biology Bachelor’s Degree Schools | 137 |
| Best General Biology Schools | 139 |
During the 2021-2022 academic year, The University of Alabama handed out 202 bachelor's degrees in general biology. This is a decrease of 21% over the previous year when 256 degrees were handed out.
In 2022, 19 students received their master’s degree in biology from UA. This makes it the #86 most popular school for biology master’s degree candidates in the country.
In addition, 5 students received their doctoral degrees in biology in 2022, making the school the #89 most popular school in the United States for this category of students.
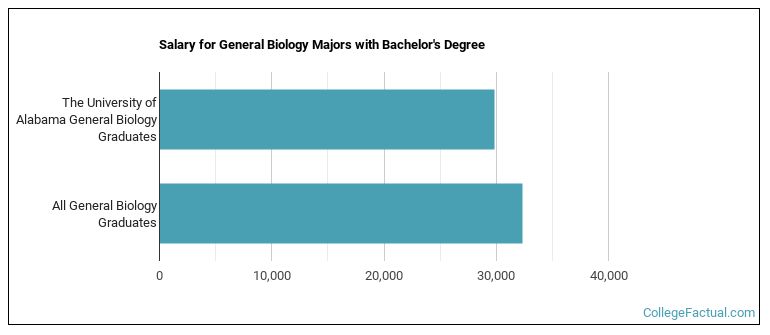
The median salary of biology students who receive their bachelor's degree at UA is $29,848. Unfortunately, this is lower than the national average of $32,337 for all biology students.
The typical student loan payment of a bachelor's degree student from the biology program at UA is $534 per month.
During the 2022-2023 academic year, part-time undergraduate students at UA paid an average of $1,425 per credit hour if they came to the school from out-of-state. In-state students paid a discounted rate of $545 per credit hour. The following table shows the average full-time tuition and fees for undergraduates.
| In State | Out of State | |
|---|---|---|
| Tuition | $11,100 | $32,400 |
| Fees | $800 | $800 |
| Books and Supplies | $800 | $800 |
| On Campus Room and Board | $14,840 | $14,840 |
| On Campus Other Expenses | $5,842 | $5,842 |
Learn more about UA tuition and fees.
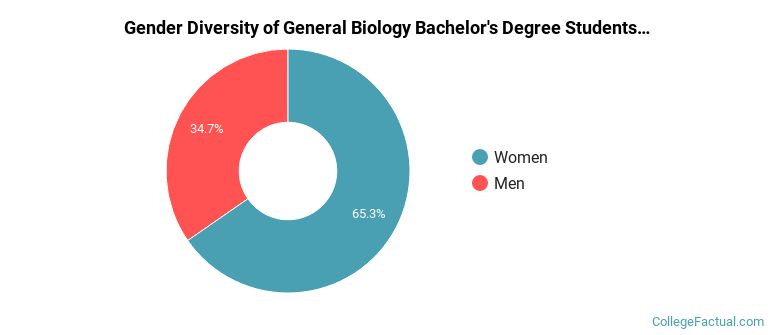
During the 2021-2022 academic year, 202 biology majors earned their bachelor's degree from UA. Of these graduates, 35% were men and 65% were women.
The majority of bachelor's degree recipients in this major at UA are white. In the most recent graduating class for which data is available, 85% of students fell into this category.
The following table and chart show the ethnic background for students who recently graduated from The University of Alabama with a bachelor's in biology.
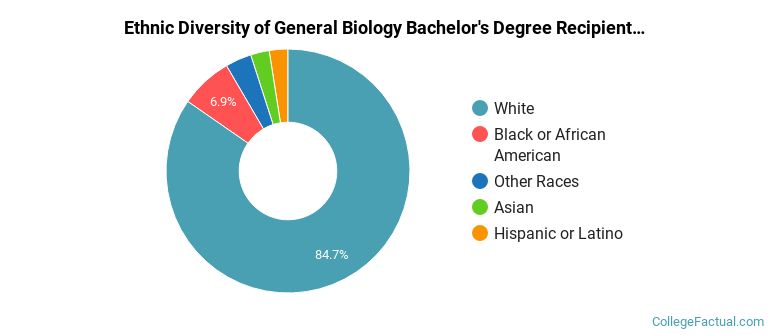
| Ethnic Background | Number of Students |
|---|---|
| Asian | 5 |
| Black or African American | 14 |
| Hispanic or Latino | 5 |
| White | 171 |
| Non-Resident Aliens | 0 |
| Other Races | 7 |
Online degrees for the UA biology bachelor’s degree program are not available at this time. To see if the school offers distance learning options in other areas, visit the UA Online Learning page.
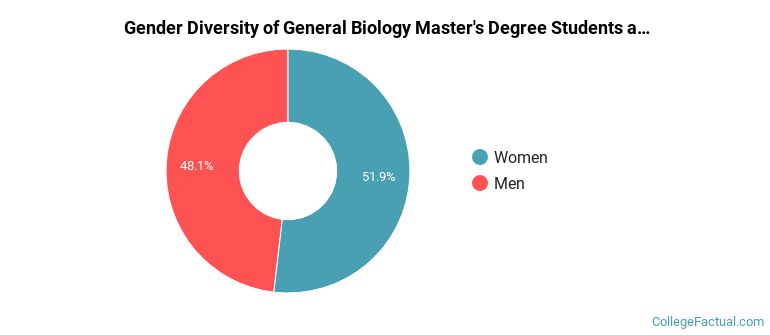
Of the 27 biology students who graduated with a master's degree in 2021-2022 from UA, about 48% were men and 52% were women.
The majority of the students with this major are white. About 78% of 2022 graduates were in this category.
The following table and chart show the ethnic background for students who recently graduated from The University of Alabama with a master's in biology.
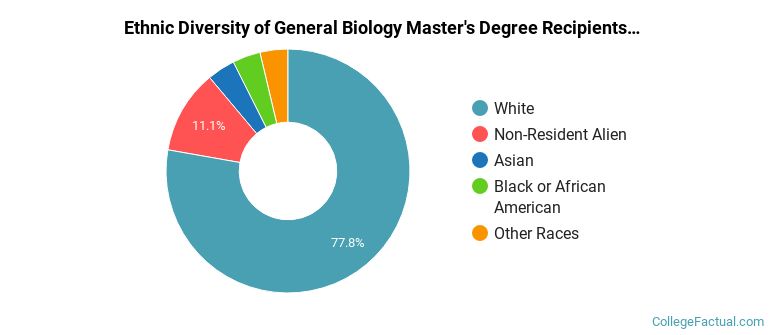
| Ethnic Background | Number of Students |
|---|---|
| Asian | 1 |
| Black or African American | 1 |
| Hispanic or Latino | 0 |
| White | 21 |
| Non-Resident Aliens | 3 |
| Other Races | 1 |
Take a look at the following statistics related to the make-up of the biology majors at The University of Alabama.
| Related Major | Annual Graduates |
|---|---|
| Ecology, Evolution & Systematics Biology | 18 |
| Microbiological Sciences & Immunology | 17 |
More about our data sources and methodologies.