UA total enrollment is approximately 37,840 students. 27,750 are undergraduates and 3,783 are graduate students.
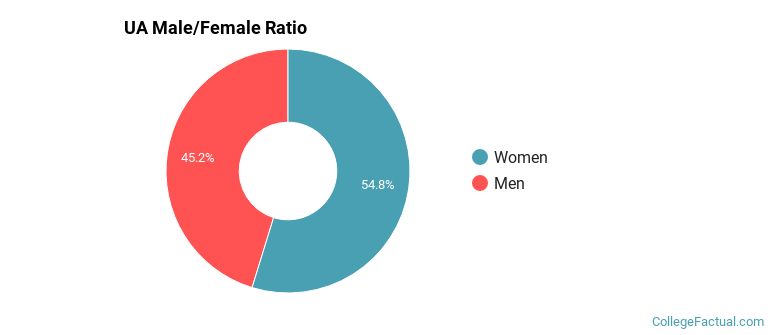
Male/Female Breakdown of Undergraduates
The full-time UA undergraduate population is made up of 55% women, and 45% men.
For the gender breakdown for all students, go here.
UA Racial/Ethnic Breakdown of Undergraduates
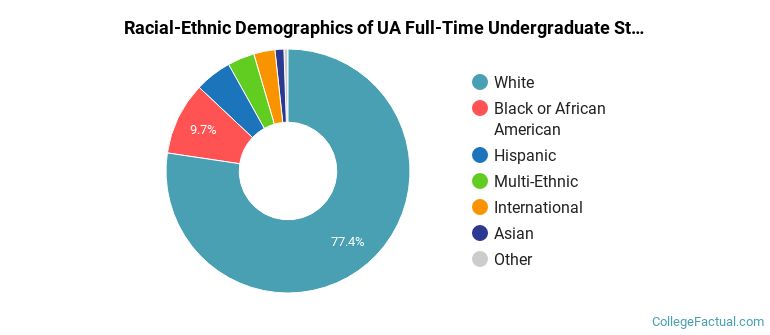
| Race/Ethnicity | Number |
|---|---|
| White | 21,517 |
| Black or African American | 2,711 |
| Hispanic | 1,366 |
| Multi-Ethnic | 1,020 |
| International | 541 |
| Asian | 358 |
| Unknown | 122 |
| Native Hawaiian or Pacific Islander | 21 |
See racial/ethnic breakdown for all students.
Male/Female Breakdown of Graduate Students
About 59% of full-time grad students are women, and 41% men.

For the gender breakdown for all students, go here.
UA Racial-Ethnic Breakdown of Graduate Students
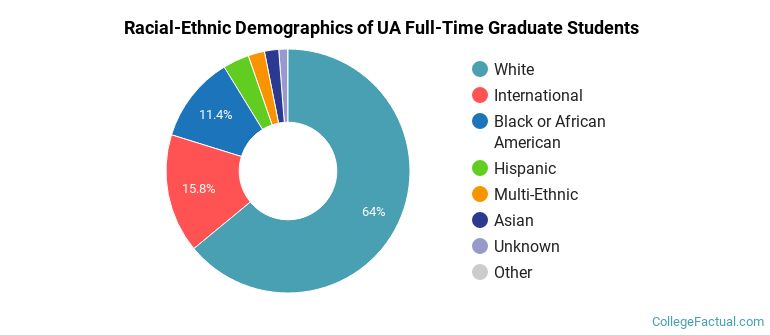
| Race/Ethnicity | Number |
|---|---|
| White | 2,453 |
| International | 528 |
| Black or African American | 439 |
| Hispanic | 141 |
| Multi-Ethnic | 104 |
| Asian | 67 |
| Unknown | 36 |
| Native Hawaiian or Pacific Islander | 3 |
See racial/ethnic breakdown for all students.
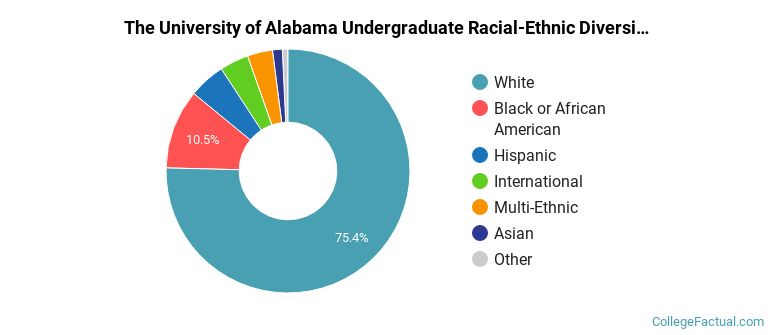
| Race/Ethnicity | Number |
|---|---|
| White | 28,415 |
| Black or African American | 4,144 |
| Hispanic | 1,870 |
| Multi-Ethnic | 1,286 |
| International | 1,176 |
| Asian | 544 |
| Unknown | 247 |
| Native Hawaiian or Pacific Islander | 31 |
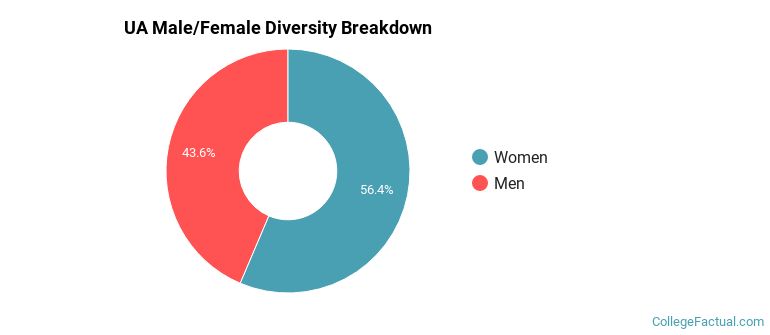
There are approximately 21,699 female students and 16,141 male students at UA.
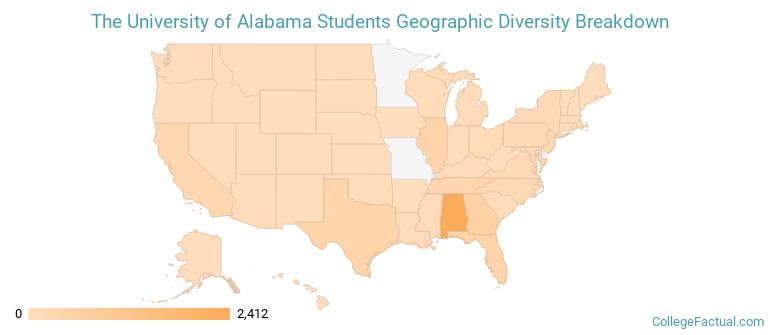
UA ranks 117 out of 2,183 when it comes to geographic diversity.
67.63% of UA students come from out of state, and 0.77% come from out of the country.
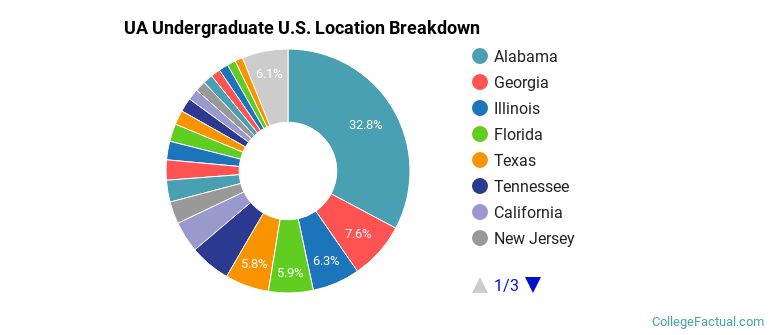
The undergraduate student body is split among 46 states (may include Washington D.C.). Click on the map for more detail.
| State | Amount |
|---|---|
| Alabama | 2,412 |
| Georgia | 560 |
| Illinois | 464 |
| Florida | 435 |
| Texas | 428 |
Students from 82 countries are represented at this school, with the majority of the international students coming from China, Saudi Arabia, and India.
Learn more about international students at UA.
A traditional college student is defined as being between the ages of 18-21. At UA, 67.28% of students fall into that category, compared to the national average of 60%.
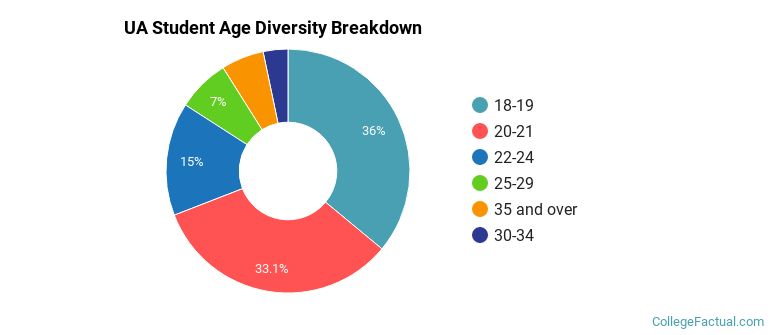
| Student Age Group | Amount |
|---|---|
| 18-19 | 13,522 |
| 20-21 | 12,422 |
| 22-24 | 5,630 |
| 25-29 | 2,614 |
| 35 and over | 2,124 |
| 30-34 | 1,232 |
| Under 18 | 0 |
Footnotes
*The racial-ethnic minorities count is calculated by taking the total number of students and subtracting white students, international students, and students whose race/ethnicity was unknown. This number is then divided by the total number of students at the school to obtain the racial-ethnic minorities percentage.
References
Department of Homeland Security Citizenship and Immigration Services
Image Credit: By Deutschlandreform under License