In its yearly rankings, College Factual analyzes over 2,000 colleges and universities to determine which ones are the best in a variety of categories, such as overall value, quality, diversity, which schools are the best for each major, and much more.
The University of Montana was awarded 12 badges in the 2025 rankings. The highest ranked major at the school is health professions.
Explore the best ranked schools for the programs you are most interested in.
College Factual ranked UM as #697 out of 2,152 colleges and universities in the country on its 2025 Best Colleges list. This is an improvement over the previous year, when UM held the #764 spot on the Best Overall Colleges list.
UM is also ranked #3 out of 12 schools in Montana.
The acceptance rate at The University of Montana is 95%, which is higher than many other schools to which you may be applying. But don't think getting into UM is a sure thing. The admissions staff is still going to review your application to see if you are a good fit for the school.
About 1% of students accepted to UM submitted their SAT scores.UM received ACT scores from 1% of accepted students.
The student to faculty ratio is often used to estimate how much interaction there is between professors and their students at a college or university. At The University of Montana, this ratio is 17 to 1, which is on par with the national average of 15 to 1. That's not bad at all.
When estimating how much access students will have to their teachers, some people like to look at what percentage of faculty members are full time. This is because part-time teachers may not have as much time to spend on campus as their full-time counterparts.
The full-time faculty percentage at The University of Montana is 67%. This is higher than the national average of 47%.
The freshmen retention rate of 74% tells us that most first-year, full-time students like The University of Montana enough to come back for another year. This is a fair bit higher than the national average of 68%. That's certainly something to check off in the good column about the school.
When it comes to finishing their studies on time, those seeking a bachelor's degree from UM have a four-year graduation rate of 30%. This is comparable to the national average of 33.3%
Find out more about the retention and graduation rates at The University of Montana.
During the 2017-2018 academic year, there were 6,975 undergraduates at UM with 5,654 being full-time and 1,321 being part-time.
| $0-30 K | $30K-48K | $48-75 | $75-110K | $110K + |
|---|---|---|---|---|
| $12,954 | $14,021 | $15,107 | $17,134 | $18,787 |
The net price is calculated by adding tuition, room, board and other costs and subtracting financial aid.Note that the net price is typically less than the published for a school. For more information on the sticker price of UM, see our tuition and fees and room and board pages.
While almost two-thirds of students nationwide take out loans to pay for college, the percentage may be quite different for the school you plan on attending. At UM, approximately 47% of students took out student loans averaging $6,337 a year. That adds up to $25,348 over four years for those students.
Get more details about paying for The University of Montana.
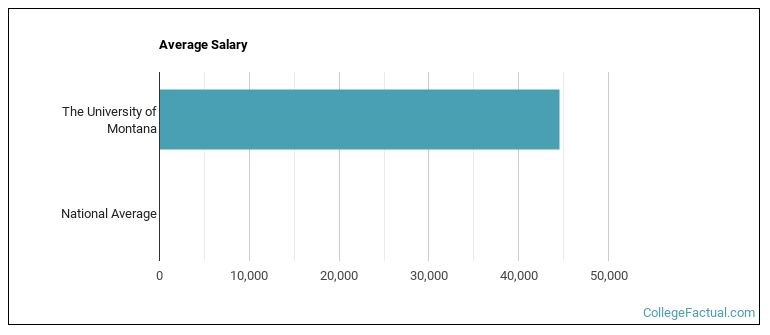
See which majors at The University of Montana make the most money.
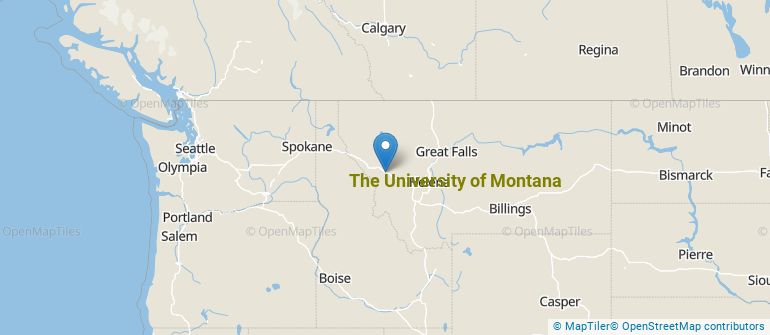
Get more details about the location of The University of Montana.
Contact details for UM are given below.
| Contact Details | |
|---|---|
| Address: | Missoula, Montana, Missoula, MT 59812 |
| Phone: | 406-243-0211 |
| Website: | www.umt.edu/ |
| Most Popular Majors | Bachelor’s Degrees | Average Salary of Graduates |
|---|---|---|
| Rehabilitation & Therapeutic Professions | 424 | NA |
| Business Administration & Management | 172 | $37,784 |
| Other Computer & Information Sciences | 150 | NA |
| Liberal Arts General Studies | 150 | NA |
| Health & Medical Administrative Services | 114 | NA |
| General Psychology | 108 | $25,023 |
| Natural Resources Conservation | 107 | $27,552 |
| Management Information Systems | 85 | $54,816 |
| Anthropology | 83 | $30,011 |
| Law | 82 | NA |
Online courses area a great option for busy, working students as well as for those who have scheduling conflicts and want to study on their own time. As time goes by, expect to see more and more online learning options become available.
In 2022-2023, 4,123 students took at least one online class at The University of Montana. This is an increase from the 3,791 students who took online classes the previous year.
| Year | Took at Least One Online Class | Took All Classes Online |
|---|---|---|
| 2022-2023 | 4,123 | 1,326 |
| 2021-2022 | 3,791 | 1,208 |
| 2020-2021 | 3,808 | 811 |
| 2018-2019 | 2,897 | 587 |
Learn more about online learning at The University of Montana.
If you’re considering The University of Montana, here are some more schools you may be interested in knowing more about.
Curious on how these schools stack up against UM? Pit them head to head with College Combat, our free interactive tool that lets you compare college on the features that matter most to you!
Footnotes
*The racial-ethnic minorities count is calculated by taking the total number of students and subtracting white students, international students, and students whose race/ethnicity was unknown. This number is then divided by the total number of students at the school to obtain the racial-ethnic minorities percentage.
References
More about our data sources and methodologies.