We’ve pulled together the essential facts you should know about the program at University of Montana. It is offered at the Associate’s level, with graduate study also available. At its best it places at #1 out of 5 schools (Associate’s level) by College Factual. Jump to any of the following sections:
College Factual rates University of Montana as a strong choice for allied health professions, coming in at #682 out of 1,080 schools nationally.
| Ranking | Rank |
|---|---|
| Best Allied Health Professions Schools | 682 of 1,080 |
| Best Allied Health Professions Schools in Montana | 3 of 6 |
| Best Allied Health Professions Schools in the Rocky Mountains Region | 22 of 33 |
The following degree levels are granted in allied health professions at University of Montana, along with how many graduates complete each level annually.
| Degree Level | Annual Graduates |
|---|---|
| Associate’s | 43 |
| Master’s | 13 |
For the most recent IPEDS reporting year, The University of Montana handed out 43 associate’s degrees in allied health professions.
University of Montana is among the very best schools in the country for allied health professions at the associate’s level. Its best result was #1 out of 5 schools by College Factual.
The full-time undergraduate tuition and fees are shown below.
| In State | Out of State | |
|---|---|---|
| Tuition | $5,352 | $30,527 |
| Fees | $2,588 | $3,144 |
Find out more about University of Montana tuition and fees.
Among recent graduates, 30% of allied health professions associate’s degrees went to men and 70% went to women.
 The largest share of allied health professions associate’s degree graduates at University of Montana were White. About 84% of graduates fell into this category.
The following table and chart show the ethnic background for students who recently graduated from The University of Montana with a associate’s in allied health professions.
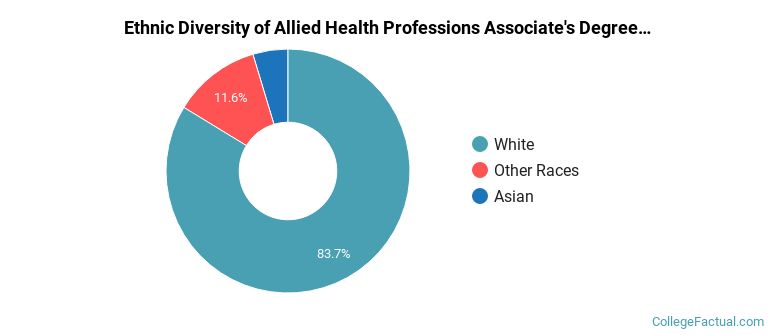
| Ethnic Background | Number of Students |
|---|---|
| Asian | 2 |
| Black or African American | 0 |
| Hispanic or Latino | 0 |
| White | 36 |
| Non-Resident Aliens | 0 |
| Other Races | 5 |
University of Montana awarded 17 associate’s degrees in radiologic technology/science - radiographer in the latest year of data — 88% to women and 12% to men. Most of these graduates identified as White (82%).
University of Montana conferred 11 associate’s degrees in emergency medical technology/technician (emt paramedic) recently — 36% to women and 64% to men. The most common background among these graduates was White (91%).
University of Montana granted 8 associate’s degrees in respiratory care therapy/therapist in the most recent reporting year — 75% to women and 25% to men. The most common background among these graduates was White (88%).
University of Montana conferred 7 associate’s degrees in surgical technology/technologist in the latest year of data — 71% to women and 29% to men. Most of these graduates identified as White (71%).
Graduate study is also available at University of Montana. Annual graduate completions by level are shown below.
| Graduate Level | Annual Graduates |
|---|---|
| Master’s Degrees in Allied Health Professions | 13 |