UM total enrollment is approximately 9,808 students. 5,654 are undergraduates and 1,175 are graduate students.
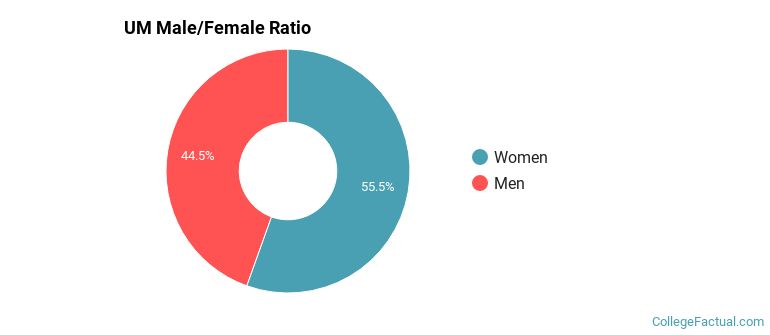
Male/Female Breakdown of Undergraduates
The full-time UM undergraduate population is made up of 57% women, and 43% men.
For the gender breakdown for all students, go here.
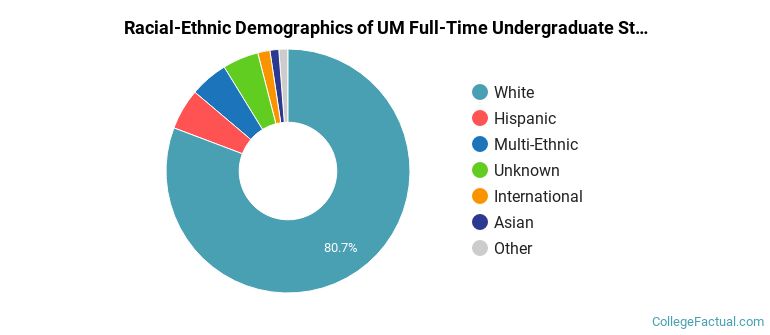
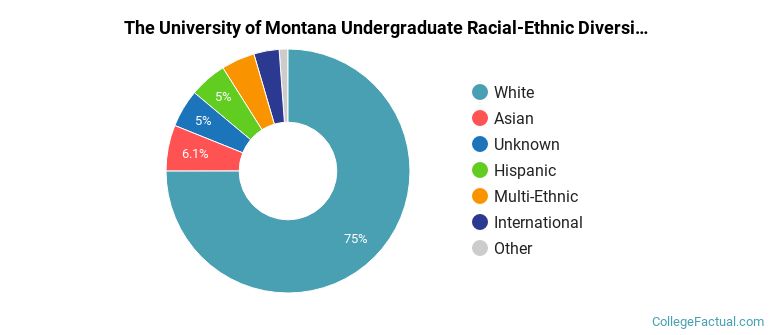
UM Racial/Ethnic Breakdown of Undergraduates
| Race/Ethnicity | Number |
|---|---|
| White | 4,289 |
| Hispanic | 306 |
| Unknown | 268 |
| Multi-Ethnic | 265 |
| Asian | 73 |
| International | 58 |
| Black or African American | 53 |
| Native Hawaiian or Pacific Islander | 9 |
See racial/ethnic breakdown for all students.
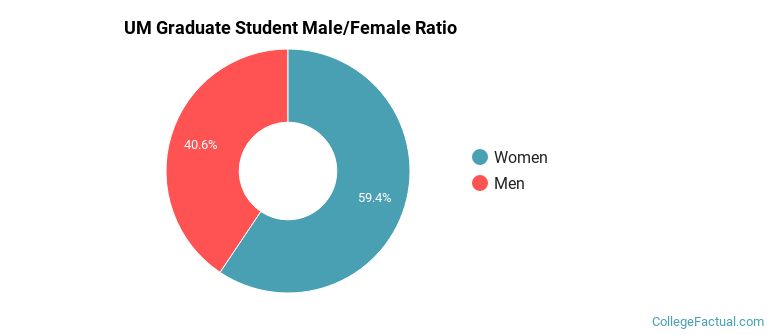
Male/Female Breakdown of Graduate Students
About 60% of full-time grad students are women, and 40% men.
For the gender breakdown for all students, go here.
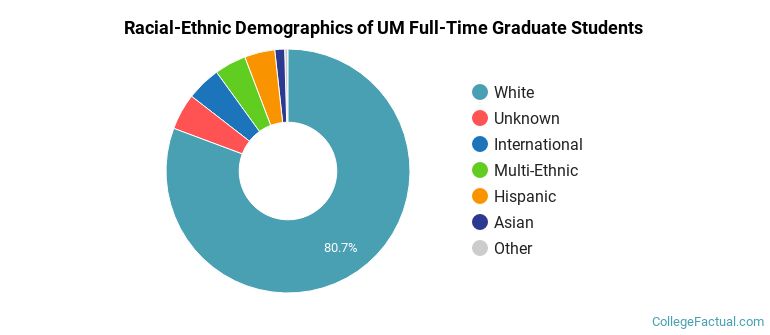
UM Racial-Ethnic Breakdown of Graduate Students
| Race/Ethnicity | Number |
|---|---|
| White | 910 |
| Unknown | 94 |
| Multi-Ethnic | 56 |
| Hispanic | 44 |
| International | 24 |
| Asian | 12 |
| Black or African American | 5 |
| Native Hawaiian or Pacific Islander | 0 |
See racial/ethnic breakdown for all students.
| Race/Ethnicity | Number |
|---|---|
| White | 6,976 |
| Asian | 664 |
| Unknown | 506 |
| Hispanic | 479 |
| Multi-Ethnic | 418 |
| International | 224 |
| Black or African American | 102 |
| Native Hawaiian or Pacific Islander | 14 |

There are approximately 5,784 female students and 4,024 male students at UM.
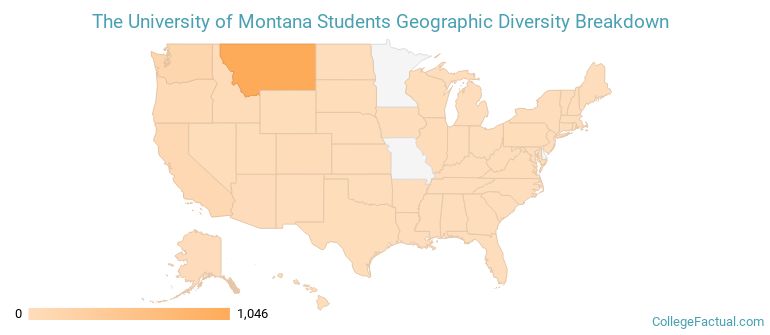
UM ranks 316 out of 2,183 when it comes to geographic diversity.
35.23% of UM students come from out of state, and 1.16% come from out of the country.
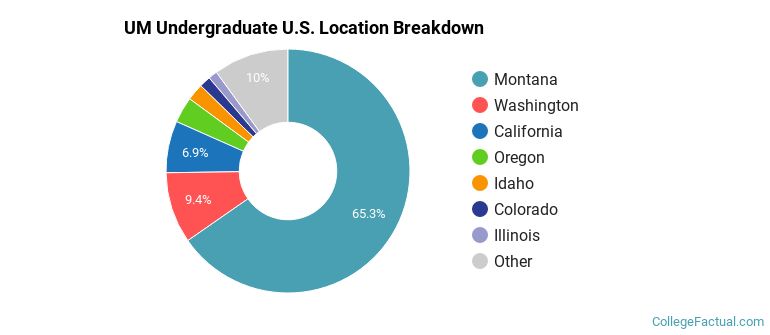
The undergraduate student body is split among 44 states (may include Washington D.C.). Click on the map for more detail.
| State | Amount |
|---|---|
| Montana | 1,046 |
| Washington | 151 |
| California | 110 |
| Oregon | 55 |
| Idaho | 36 |
Students from 60 countries are represented at this school, with the majority of the international students coming from China, Japan, and Saudi Arabia.
Learn more about international students at UM.
A traditional college student is defined as being between the ages of 18-21. At UM, 41.80% of students fall into that category, compared to the national average of 60%.
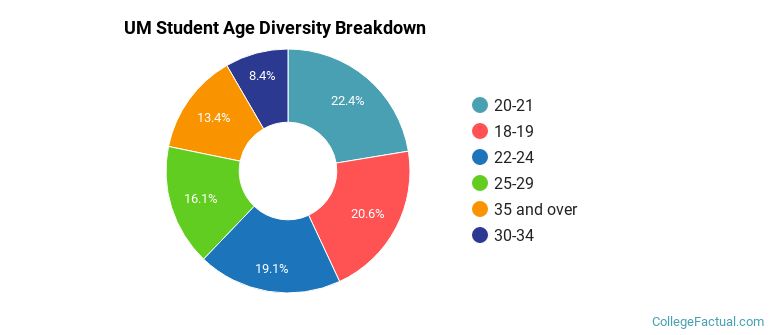
| Student Age Group | Amount |
|---|---|
| 20-21 | 2,581 |
| 18-19 | 2,379 |
| 22-24 | 2,201 |
| 25-29 | 1,852 |
| 35 and over | 1,545 |
| 30-34 | 964 |
| Under 18 | 0 |
Footnotes
*The racial-ethnic minorities count is calculated by taking the total number of students and subtracting white students, international students, and students whose race/ethnicity was unknown. This number is then divided by the total number of students at the school to obtain the racial-ethnic minorities percentage.
References
Department of Homeland Security Citizenship and Immigration Services
Read College Factual's Diversity Ranking Methodology.