Go directly to any of the following sections:
The bachelor's program at UT was ranked #207 on College Factual's Best Schools for parks & rec list. It is also ranked #7 in Florida.
| Ranking Type | Rank |
|---|---|
| Best Parks, Recreation, Leisure, & Fitness Studies Bachelor’s Degree Schools | 202 |
| Best Parks, Recreation, Leisure, & Fitness Studies Schools | 207 |
During the 2021-2022 academic year, The University of Tampa handed out 81 bachelor's degrees in parks, recreation, leisure, & fitness studies. This is an increase of 40% over the previous year when 58 degrees were handed out.
During the 2022-2023 academic year, part-time undergraduate students at UT paid an average of $664 per credit hour. No discount was available for in-state students. Information about average full-time undergraduate tuition and fees is shown in the table below.
| In State | Out of State | |
|---|---|---|
| Tuition | $31,162 | $31,162 |
| Fees | $2,262 | $2,262 |
| Books and Supplies | $1,500 | $1,500 |
| On Campus Room and Board | $12,676 | $12,676 |
| On Campus Other Expenses | $4,130 | $4,130 |
Learn more about UT tuition and fees.
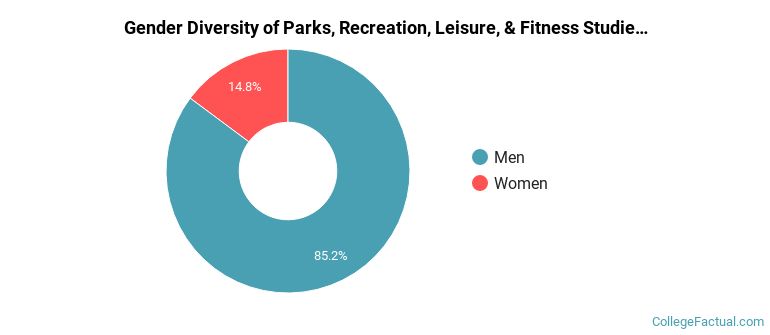
The parks & rec program at UT awarded 81 bachelor's degrees in 2021-2022. About 85% of these degrees went to men with the other 15% going to women.
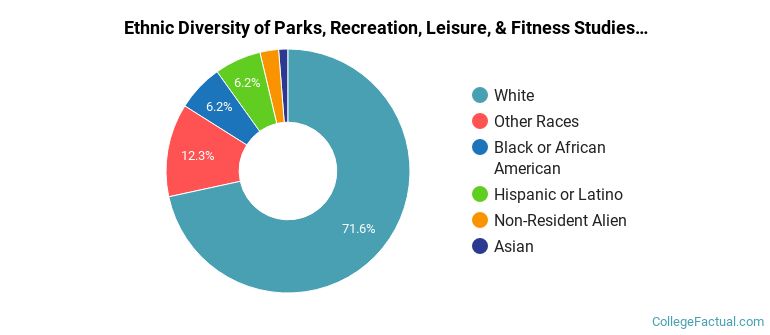
The majority of bachelor's degree recipients in this major at UT are white. In the most recent graduating class for which data is available, 72% of students fell into this category.
The following table and chart show the ethnic background for students who recently graduated from The University of Tampa with a bachelor's in parks & rec.
| Ethnic Background | Number of Students |
|---|---|
| Asian | 1 |
| Black or African American | 5 |
| Hispanic or Latino | 5 |
| White | 58 |
| Non-Resident Aliens | 2 |
| Other Races | 10 |
Online degrees for the UT parks & rec bachelor’s degree program are not available at this time. To see if the school offers distance learning options in other areas, visit the UT Online Learning page.
Take a look at the following statistics related to the make-up of the parks & rec majors at The University of Tampa.
Parks, Recreation, Leisure, & Fitness Studies students may decide to major in one of the following focus areas. Individual majors may not be available for all degree levels.
| Major | Annual Graduates |
|---|---|
| Health & Physical Education | 81 |
More about our data sources and methodologies.