Below are the key facts about this program at The University of Tennessee-Knoxville. You can study it at the Bachelor’s level, with graduate study also available. Jump to any of the following sections:
Here is each degree level granted in child development & psychology at The University of Tennessee-Knoxville, along with how many graduates complete each level annually.
| Degree Level | Annual Graduates |
|---|---|
| Bachelor’s | 362 |
| Master’s | 16 |
| Doctoral | 15 |
In the most recent year for which we have data, The University of Tennessee-Knoxville awarded 362 bachelor’s degrees in child development & psychology.
The University of Tennessee-Knoxville has not been ranked for child development & psychology at the bachelor’s level.
Information about average full-time undergraduate tuition and fees is shown in the table below.
| In State | Out of State | |
|---|---|---|
| Tuition | $11,332 | $30,704 |
| Fees | $2,252 | $2,552 |
Find out more about The University of Tennessee-Knoxville tuition and fees.
In the most recent graduating class, 16% of child development & psychology bachelor’s degrees went to men and 84% went to women.
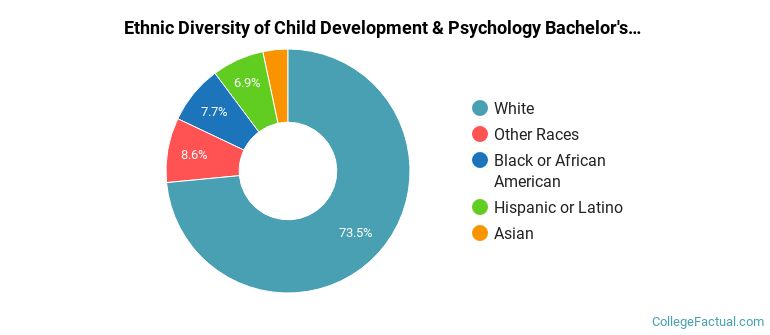
 The majority of child development & psychology bachelor’s degree graduates at The University of Tennessee-Knoxville were White. About 73% of graduates fell into this category.
The following table and chart show the ethnic background for students who recently graduated from The University of Tennessee-Knoxville with a bachelor’s in child development & psychology.
| Ethnic Background | Number of Students |
|---|---|
| Asian | 12 |
| Black or African American | 28 |
| Hispanic or Latino | 25 |
| White | 266 |
| Non-Resident Aliens | 0 |
| Other Races | 31 |
The University of Tennessee-Knoxville granted 362 bachelor’s completions in research and experimental psychology, other recently — 84% to women and 16% to men. Most of these graduates identified as White (73%).
Graduate study is also available at The University of Tennessee-Knoxville. The following graduate award levels are reported.
| Graduate Level | Annual Graduates |
|---|---|
| Master’s Degrees in Child Development & Psychology | 16 |
| Doctoral Degrees in Child Development & Psychology | 15 |