UT Arlington total enrollment is approximately 48,072 students. 19,770 are undergraduates and 3,889 are graduate students.
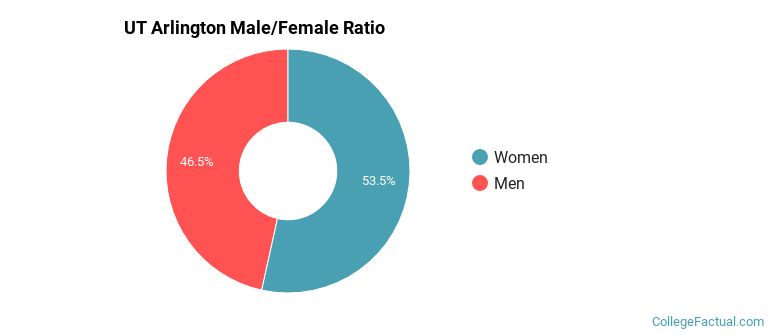
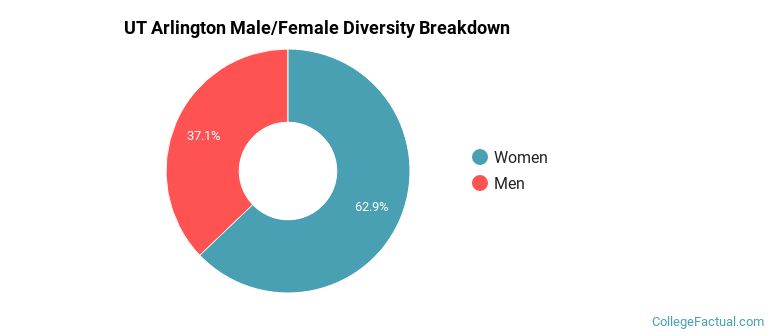
Male/Female Breakdown of Undergraduates
The full-time UT Arlington undergraduate population is made up of 55% women, and 45% men.
For the gender breakdown for all students, go here.
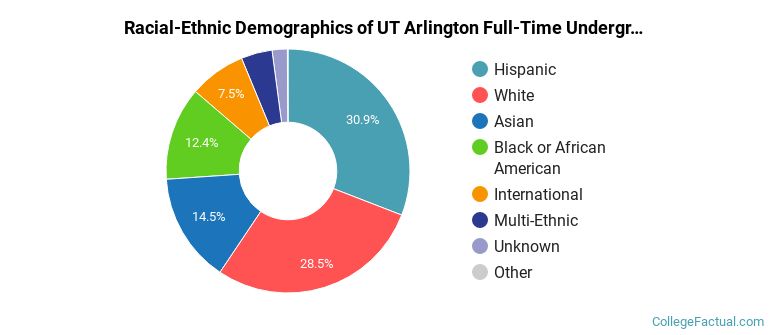
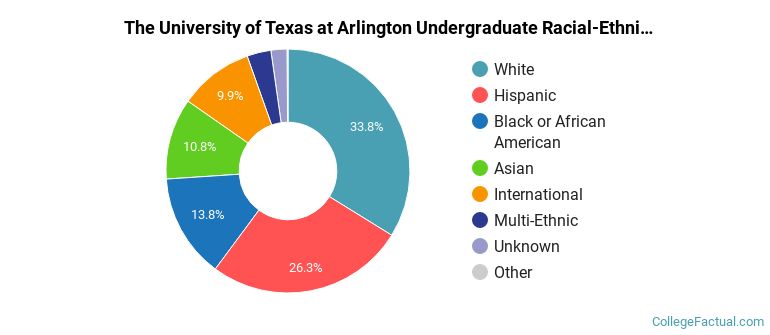
UT Arlington Racial/Ethnic Breakdown of Undergraduates
| Race/Ethnicity | Number |
|---|---|
| Hispanic | 6,249 |
| White | 5,448 |
| Asian | 3,011 |
| Black or African American | 2,485 |
| International | 1,277 |
| Multi-Ethnic | 846 |
| Unknown | 396 |
| Native Hawaiian or Pacific Islander | 12 |
See racial/ethnic breakdown for all students.
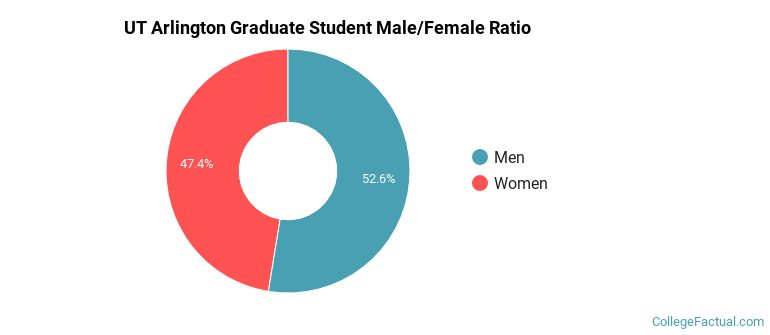
Male/Female Breakdown of Graduate Students
About 52% of full-time grad students are women, and 48% men.
For the gender breakdown for all students, go here.
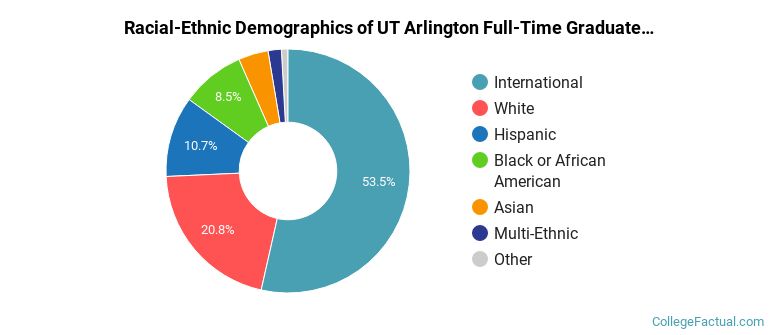
UT Arlington Racial-Ethnic Breakdown of Graduate Students
| Race/Ethnicity | Number |
|---|---|
| International | 1,786 |
| White | 883 |
| Hispanic | 520 |
| Black or African American | 397 |
| Asian | 167 |
| Multi-Ethnic | 94 |
| Unknown | 33 |
| Native Hawaiian or Pacific Islander | 1 |
See racial/ethnic breakdown for all students.
| Race/Ethnicity | Number |
|---|---|
| White | 15,681 |
| Hispanic | 13,245 |
| Black or African American | 6,899 |
| Asian | 5,455 |
| International | 3,943 |
| Multi-Ethnic | 1,640 |
| Unknown | 1,033 |
| Native Hawaiian or Pacific Islander | 48 |
There are approximately 30,671 female students and 17,401 male students at UT Arlington.
UT Arlington ranks 1,295 out of 2,183 when it comes to geographic diversity.
2.46% of UT Arlington students come from out of state, and 5.24% come from out of the country.
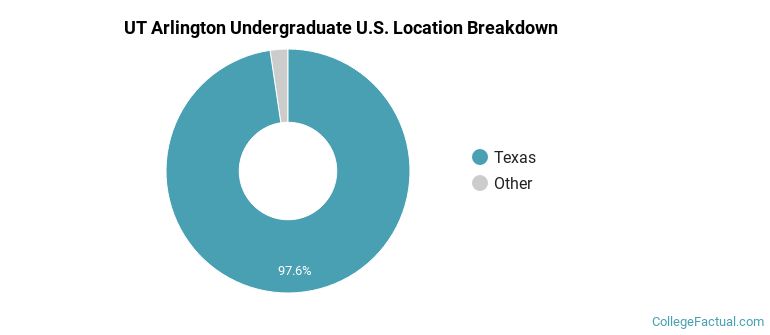
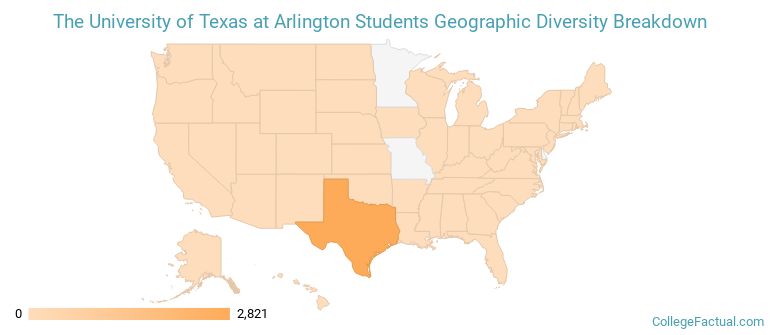
The undergraduate student body is split among 29 states (may include Washington D.C.). Click on the map for more detail.
| State | Amount |
|---|---|
| Texas | 2,821 |
| California | 11 |
| Arkansas | 6 |
| Florida | 5 |
| Washington | 5 |
Students from 116 countries are represented at this school, with the majority of the international students coming from India, China, and Nepal.
Learn more about international students at UT Arlington.
A traditional college student is defined as being between the ages of 18-21. At UT Arlington, 22.15% of students fall into that category, compared to the national average of 60%.
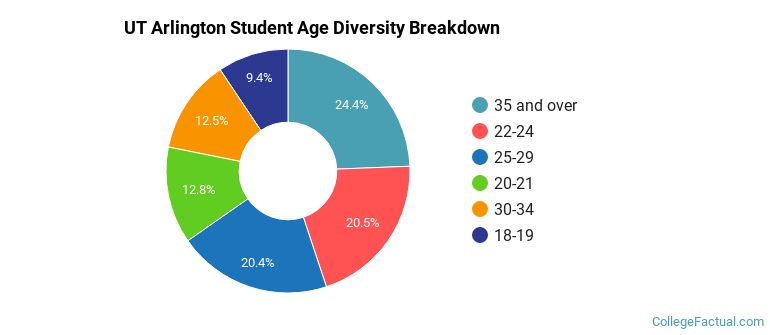
| Student Age Group | Amount |
|---|---|
| 35 and over | 11,293 |
| 22-24 | 9,504 |
| 25-29 | 9,456 |
| 20-21 | 5,949 |
| 30-34 | 5,770 |
| 18-19 | 4,350 |
| Under 18 | 0 |
Footnotes
*The racial-ethnic minorities count is calculated by taking the total number of students and subtracting white students, international students, and students whose race/ethnicity was unknown. This number is then divided by the total number of students at the school to obtain the racial-ethnic minorities percentage.
References