UTEP total enrollment is approximately 24,879 students. 14,632 are undergraduates and 1,524 are graduate students.
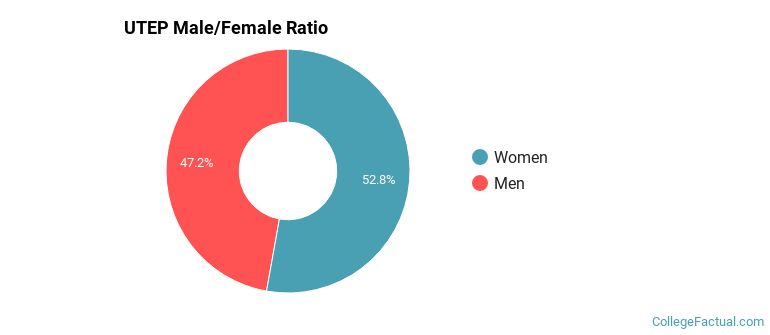
Male/Female Breakdown of Undergraduates
The full-time UTEP undergraduate population is made up of 55% women, and 45% men.
For the gender breakdown for all students, go here.
UTEP Racial/Ethnic Breakdown of Undergraduates
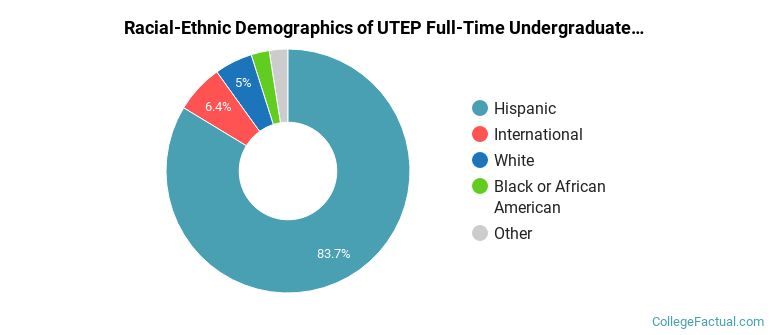
| Race/Ethnicity | Number |
|---|---|
| Hispanic | 12,455 |
| International | 754 |
| White | 708 |
| Black or African American | 330 |
| Multi-Ethnic | 126 |
| Asian | 107 |
| Unknown | 101 |
| Native Hawaiian or Pacific Islander | 25 |
See racial/ethnic breakdown for all students.
Male/Female Breakdown of Graduate Students
About 54% of full-time grad students are women, and 46% men.

For the gender breakdown for all students, go here.
UTEP Racial-Ethnic Breakdown of Graduate Students
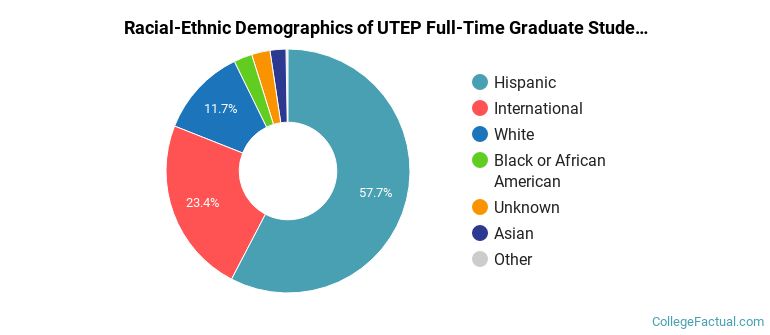
| Race/Ethnicity | Number |
|---|---|
| Hispanic | 950 |
| International | 298 |
| White | 176 |
| Black or African American | 40 |
| Asian | 33 |
| Unknown | 21 |
| Multi-Ethnic | 2 |
| Native Hawaiian or Pacific Islander | 1 |
See racial/ethnic breakdown for all students.
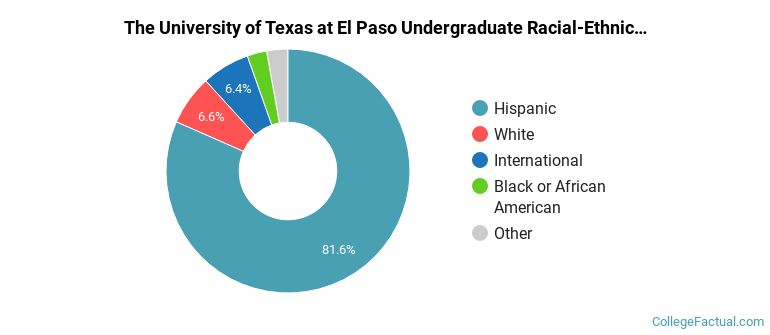
| Race/Ethnicity | Number |
|---|---|
| Hispanic | 20,610 |
| White | 1,563 |
| International | 1,387 |
| Black or African American | 613 |
| Asian | 236 |
| Unknown | 217 |
| Multi-Ethnic | 171 |
| Native Hawaiian or Pacific Islander | 37 |
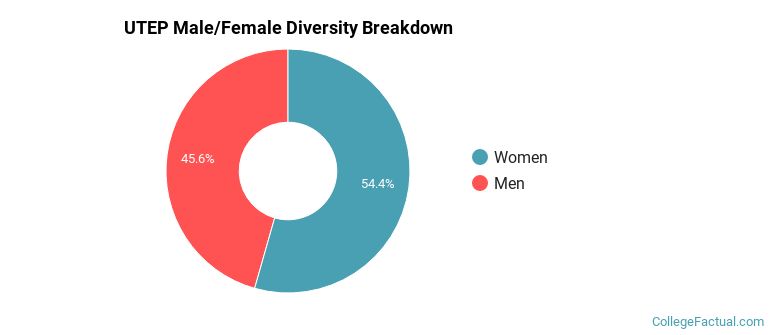
There are approximately 13,907 female students and 10,972 male students at UTEP.
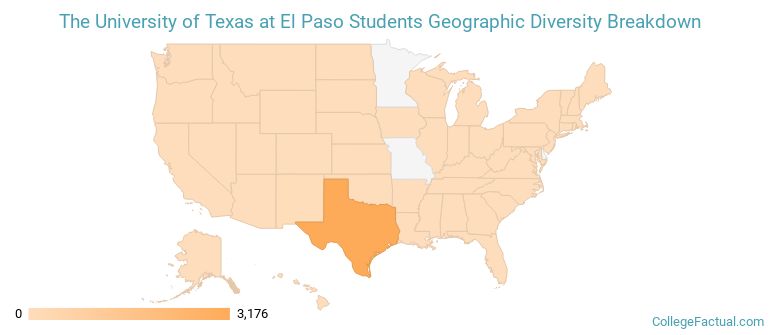
UTEP ranks 1,401 out of 2,183 when it comes to geographic diversity.
2.37% of UTEP students come from out of state, and 5.49% come from out of the country.
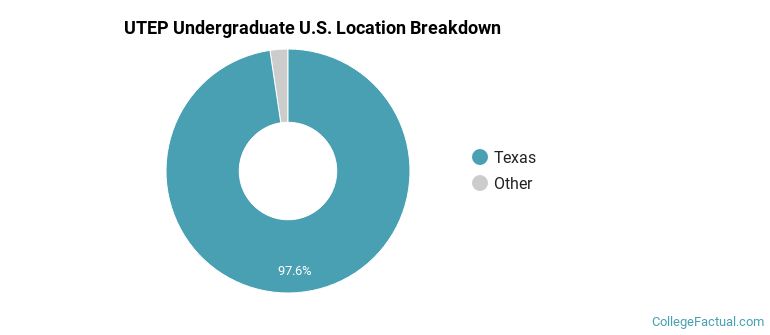
The undergraduate student body is split among 25 states (may include Washington D.C.). Click on the map for more detail.
| State | Amount |
|---|---|
| Texas | 3,176 |
| New Mexico | 17 |
| California | 13 |
| Florida | 6 |
| Georgia | 6 |
Students from 77 countries are represented at this school, with the majority of the international students coming from Mexico, Kuwait, and India.
Learn more about international students at UTEP.
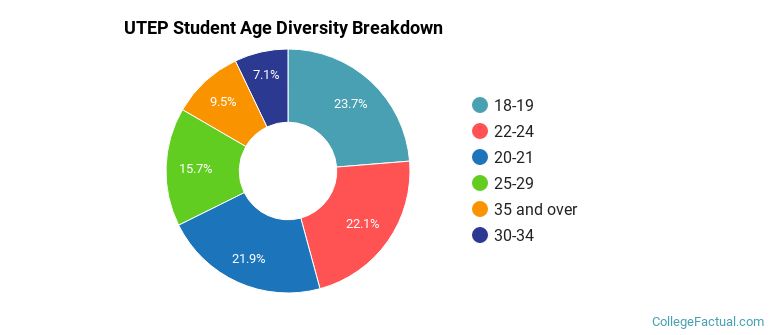
A traditional college student is defined as being between the ages of 18-21. At UTEP, 45.07% of students fall into that category, compared to the national average of 60%.
| Student Age Group | Amount |
|---|---|
| 18-19 | 5,875 |
| 22-24 | 5,467 |
| 20-21 | 5,427 |
| 25-29 | 3,889 |
| 35 and over | 2,360 |
| 30-34 | 1,760 |
| Under 18 | 0 |
Footnotes
*The racial-ethnic minorities count is calculated by taking the total number of students and subtracting white students, international students, and students whose race/ethnicity was unknown. This number is then divided by the total number of students at the school to obtain the racial-ethnic minorities percentage.
References
Department of Homeland Security Citizenship and Immigration Services
Image Credit: By Adrian Garcia under License
Read College Factual's Diversity Ranking Methodology.