UTSA total enrollment is approximately 34,742 students. 23,018 are undergraduates and 2,235 are graduate students.
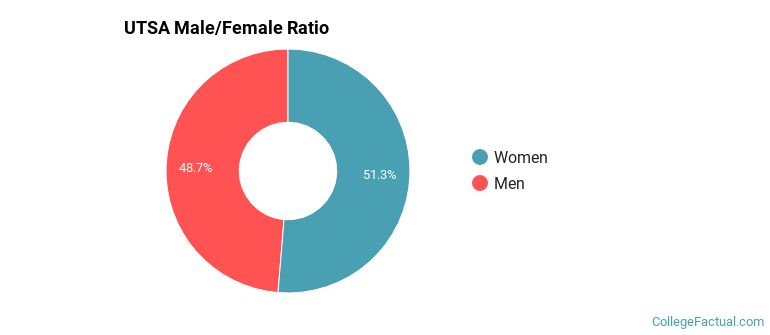
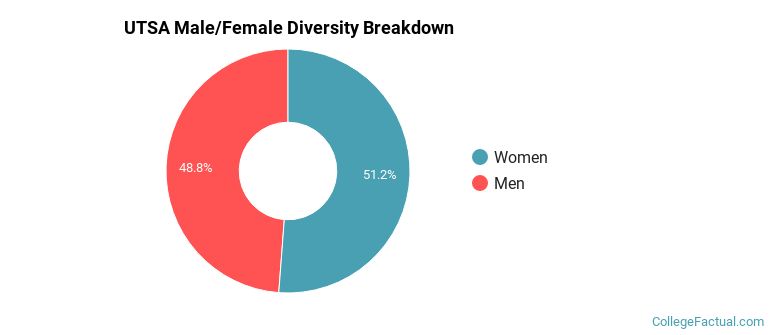
Male/Female Breakdown of Undergraduates
The full-time UTSA undergraduate population is made up of 52% women, and 48% men.
For the gender breakdown for all students, go here.
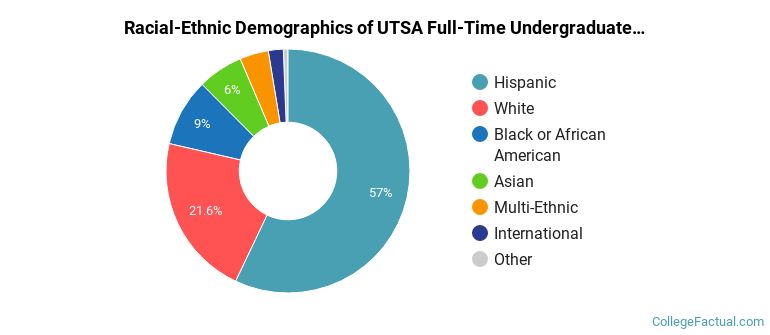
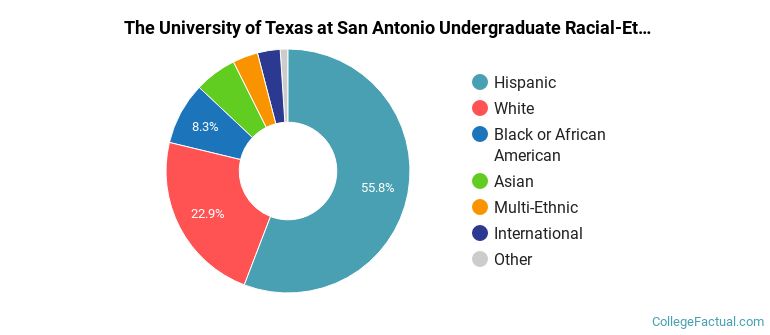
UTSA Racial/Ethnic Breakdown of Undergraduates
| Race/Ethnicity | Number |
|---|---|
| Hispanic | 13,549 |
| White | 4,728 |
| Black or African American | 2,005 |
| Asian | 1,313 |
| Multi-Ethnic | 887 |
| International | 380 |
| Unknown | 100 |
| Native Hawaiian or Pacific Islander | 31 |
See racial/ethnic breakdown for all students.
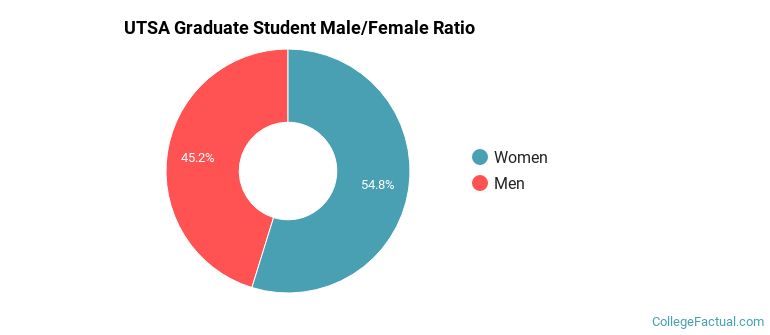
Male/Female Breakdown of Graduate Students
About 55% of full-time grad students are women, and 45% men.
For the gender breakdown for all students, go here.
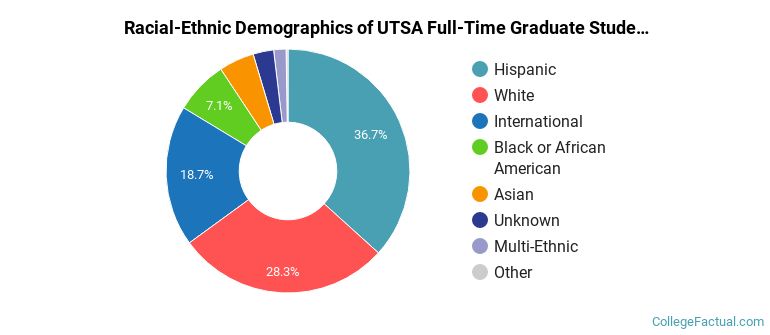
UTSA Racial-Ethnic Breakdown of Graduate Students
| Race/Ethnicity | Number |
|---|---|
| Hispanic | 878 |
| White | 632 |
| International | 366 |
| Black or African American | 159 |
| Asian | 118 |
| Multi-Ethnic | 36 |
| Unknown | 35 |
| Native Hawaiian or Pacific Islander | 6 |
See racial/ethnic breakdown for all students.
| Race/Ethnicity | Number |
|---|---|
| Hispanic | 19,809 |
| White | 7,739 |
| Black or African American | 2,812 |
| Asian | 1,899 |
| Multi-Ethnic | 1,187 |
| International | 927 |
| Unknown | 264 |
| Native Hawaiian or Pacific Islander | 54 |
There are approximately 18,043 female students and 16,699 male students at UTSA.
UTSA ranks 1,236 out of 2,183 when it comes to geographic diversity.
2.25% of UTSA students come from out of state, and 1.26% come from out of the country.
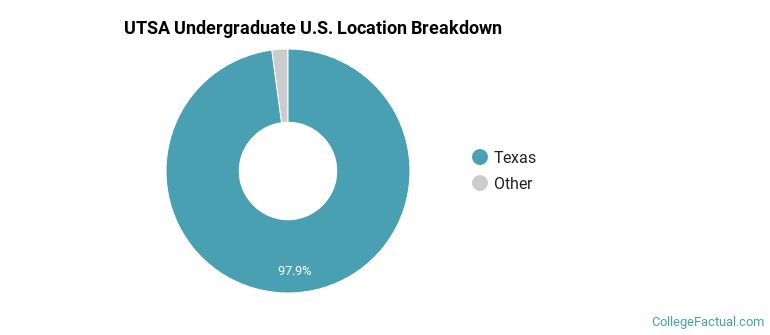
The undergraduate student body is split among 33 states (may include Washington D.C.). Click on the map for more detail.
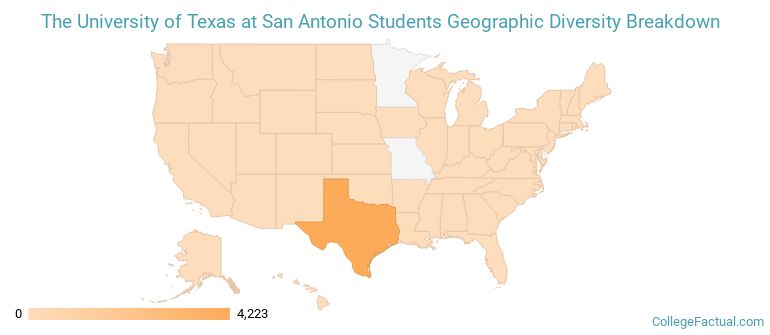
| State | Amount |
|---|---|
| Texas | 4,223 |
| California | 14 |
| Virginia | 8 |
| Florida | 6 |
| Illinois | 6 |
Students from 98 countries are represented at this school, with the majority of the international students coming from India, Mexico, and China.
Learn more about international students at UTSA.
A traditional college student is defined as being between the ages of 18-21. At UTSA, 54.69% of students fall into that category, compared to the national average of 60%.
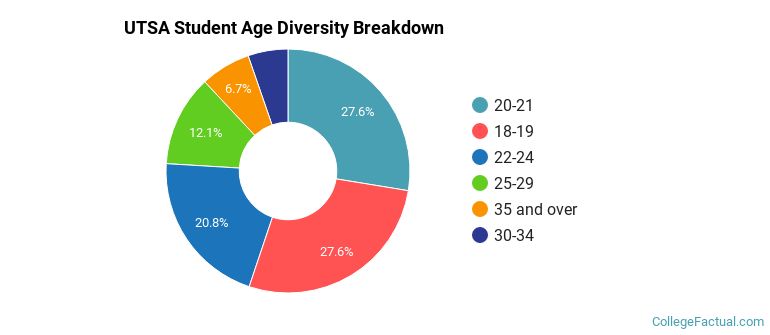
| Student Age Group | Amount |
|---|---|
| 20-21 | 8,415 |
| 18-19 | 8,412 |
| 22-24 | 6,347 |
| 25-29 | 3,688 |
| 35 and over | 2,029 |
| 30-34 | 1,618 |
| Under 18 | 0 |
Footnotes
*The racial-ethnic minorities count is calculated by taking the total number of students and subtracting white students, international students, and students whose race/ethnicity was unknown. This number is then divided by the total number of students at the school to obtain the racial-ethnic minorities percentage.
References
Department of Homeland Security Citizenship and Immigration Services
Image Credit: By BrianReading under License