UTHealth total enrollment is approximately 5,608 students. 579 are undergraduates and 2,921 are graduate students.
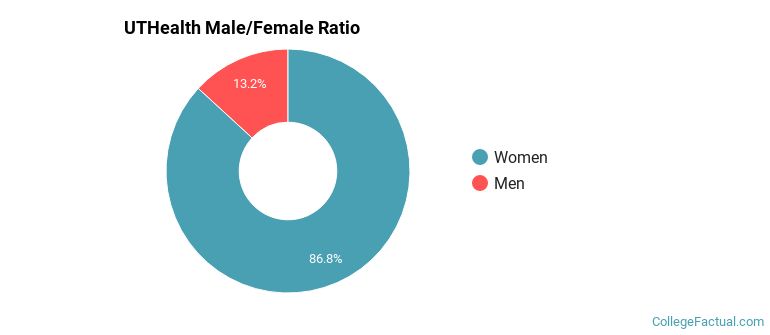
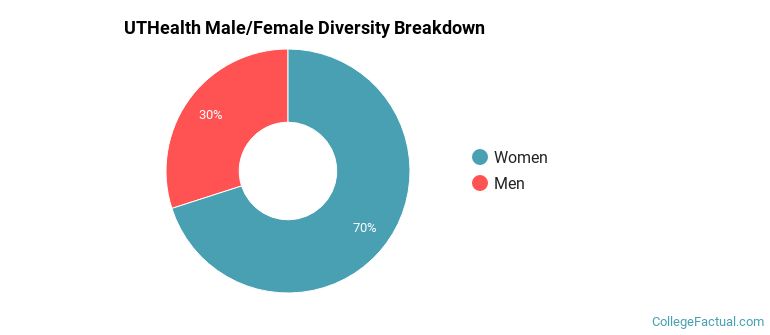
Male/Female Breakdown of Undergraduates
The full-time UTHealth undergraduate population is made up of 87% women, and 13% men.
For the gender breakdown for all students, go here.
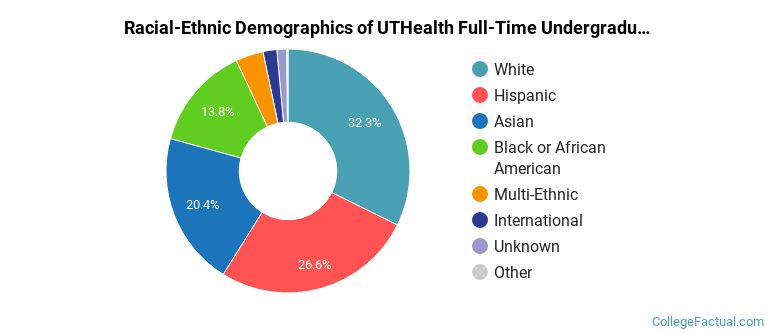
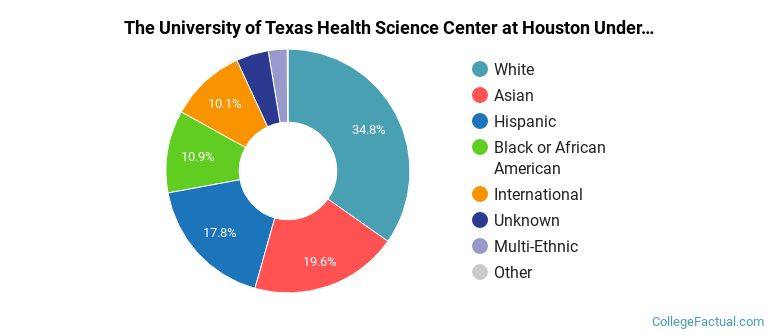
UTHealth Racial/Ethnic Breakdown of Undergraduates
| Race/Ethnicity | Number |
|---|---|
| White | 161 |
| Asian | 155 |
| Hispanic | 139 |
| Black or African American | 78 |
| Multi-Ethnic | 21 |
| International | 13 |
| Unknown | 10 |
| Native Hawaiian or Pacific Islander | 1 |
See racial/ethnic breakdown for all students.
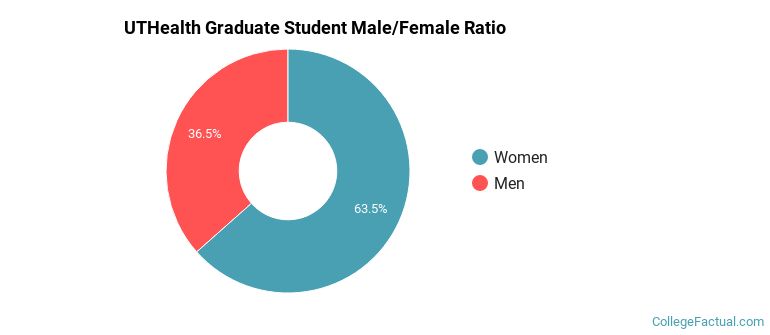
Male/Female Breakdown of Graduate Students
About 64% of full-time grad students are women, and 36% men.
For the gender breakdown for all students, go here.
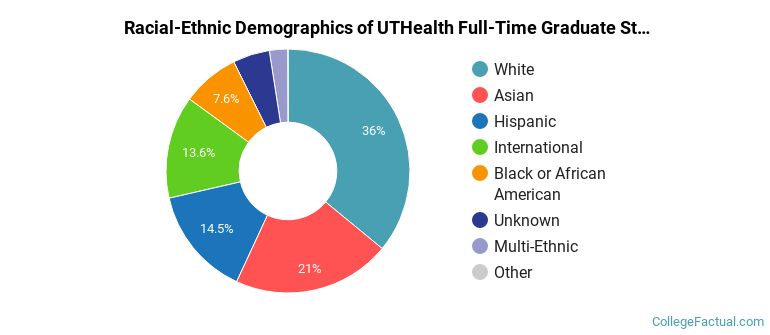
UTHealth Racial-Ethnic Breakdown of Graduate Students
| Race/Ethnicity | Number |
|---|---|
| White | 1,055 |
| Asian | 581 |
| Hispanic | 459 |
| International | 380 |
| Black or African American | 239 |
| Unknown | 123 |
| Multi-Ethnic | 78 |
| Native Hawaiian or Pacific Islander | 0 |
See racial/ethnic breakdown for all students.
| Race/Ethnicity | Number |
|---|---|
| White | 1,902 |
| Asian | 1,077 |
| Hispanic | 1,008 |
| Black or African American | 675 |
| International | 560 |
| Unknown | 223 |
| Multi-Ethnic | 150 |
| Native Hawaiian or Pacific Islander | 3 |
There are approximately 3,968 female students and 1,640 male students at UTHealth.
Students from 56 countries are represented at this school, with the majority of the international students coming from China, India, and Nigeria.
Learn more about international students at UTHealth.
A traditional college student is defined as being between the ages of 18-21. At UTHealth, 2.92% of students fall into that category, compared to the national average of 60%.
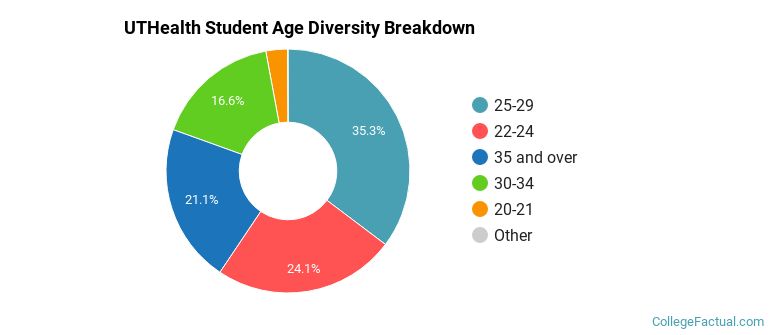
| Student Age Group | Amount |
|---|---|
| 25-29 | 1,849 |
| 22-24 | 1,265 |
| 35 and over | 1,105 |
| 30-34 | 869 |
| 20-21 | 150 |
| 18-19 | 3 |
| Under 18 | 0 |
Footnotes
*The racial-ethnic minorities count is calculated by taking the total number of students and subtracting white students, international students, and students whose race/ethnicity was unknown. This number is then divided by the total number of students at the school to obtain the racial-ethnic minorities percentage.
References
Department of Homeland Security Citizenship and Immigration Services
Learn more about how College Factual creates their Diversity Rankings.