Here, you'll find out more about the major, including such details as the number of graduates, what degree levels are offered, ethnicity of students, average salaries, and more. We've also included details on how UT Rio Grande Valley ranks compared to other colleges offering a major in criminal justice.
Jump to any of the following sections:
The bachelor's program at UT Rio Grande Valley was ranked #139 on College Factual's Best Schools for criminal justice list. It is also ranked #7 in Texas.
During the 2021-2022 academic year, The University of Texas Rio Grande Valley handed out 581 bachelor's degrees in criminal justice & corrections. This is an increase of 12% over the previous year when 520 degrees were handed out.
In 2022, 24 students received their master’s degree in criminal justice from UT Rio Grande Valley. This makes it the #63 most popular school for criminal justice master’s degree candidates in the country.
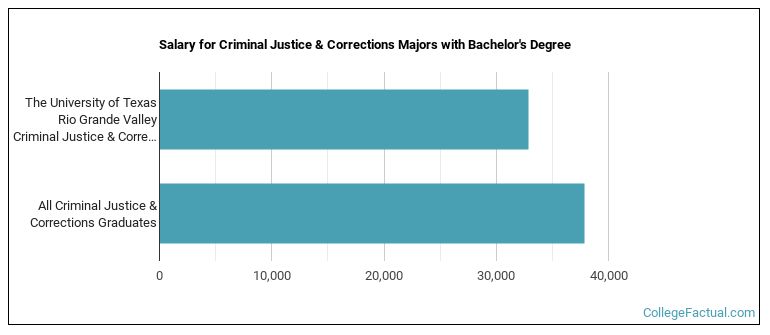
Criminal Justice majors who earn their bachelor's degree from UT Rio Grande Valley go on to jobs where they make a median salary of $32,899 a year. This is less than $37,901, which is the national median of all criminal justice majors in the nation who earn bachelor's degrees.
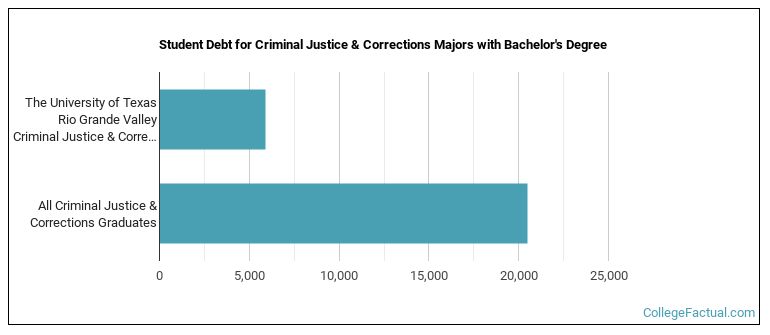
While getting their bachelor's degree at UT Rio Grande Valley, criminal justice students borrow a median amount of $5,929 in student loans. This is not too bad considering that the median debt load of all criminal justice bachelor's degree recipients across the country is $20,504.
Out-of-state part-time undergraduates at UT Rio Grande Valley paid an average of $742 per credit hour in 2022-2023. The average for in-state students was $332 per credit hour. The average full-time tuition and fees for undergraduates are shown in the table below.
| In State | Out of State | |
|---|---|---|
| Tuition | $7,637 | $17,707 |
| Fees | $1,830 | $1,835 |
| Books and Supplies | $1,190 | $1,190 |
| On Campus Room and Board | $9,662 | $9,662 |
| On Campus Other Expenses | $3,766 | $3,766 |
Learn more about UT Rio Grande Valley tuition and fees.
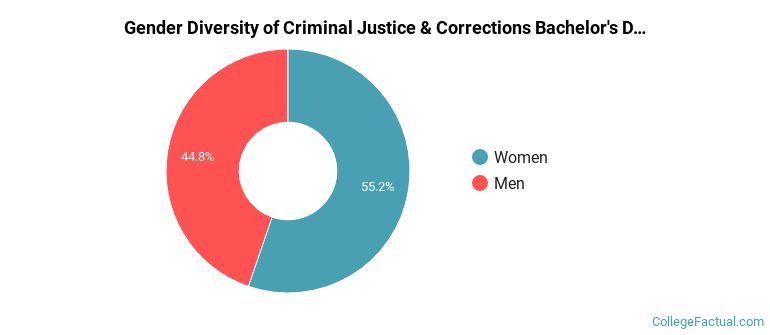
Of the 581 students who graduated with a Bachelor’s in criminal justice from UT Rio Grande Valley in 2022, 45% were men and 55% were women.
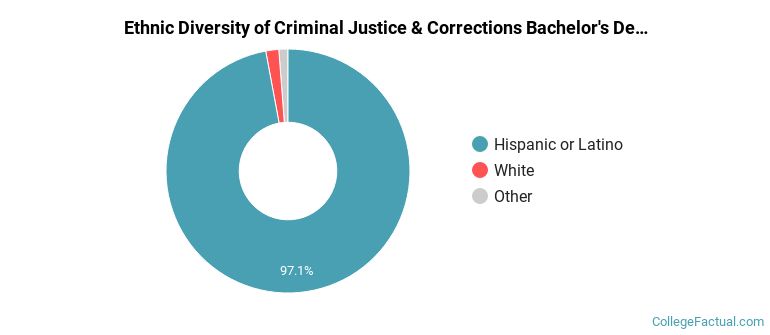
The majority of the bachelor's degree graduates for this major are Hispanic or Latino. In the most recent graduating class for which data is available, 97% of grads fell into this category.
The following table and chart show the ethnic background for students who recently graduated from The University of Texas Rio Grande Valley with a bachelor's in criminal justice.
| Ethnic Background | Number of Students |
|---|---|
| Asian | 1 |
| Black or African American | 1 |
| Hispanic or Latino | 564 |
| White | 10 |
| Non-Resident Aliens | 0 |
| Other Races | 5 |
UT Rio Grande Valley does not offer an online option for its criminal justice bachelor’s degree program at this time. To see if the school offers distance learning options in other areas, visit the UT Rio Grande Valley Online Learning page.
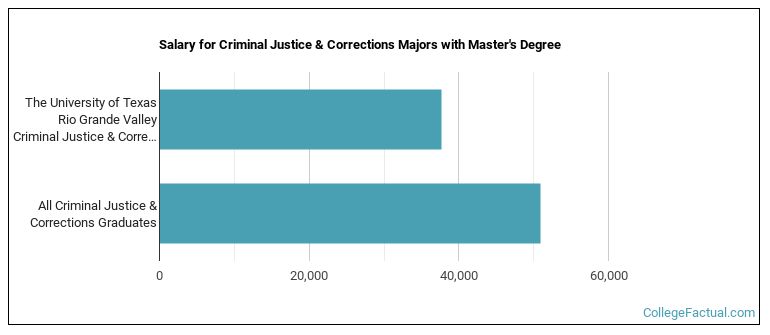
Criminal Justice majors graduating with a master's degree from UT Rio Grande Valley make a median salary of $37,728 a year. This is less than what their typical peers from other schools make. Their median salary is $50,954.
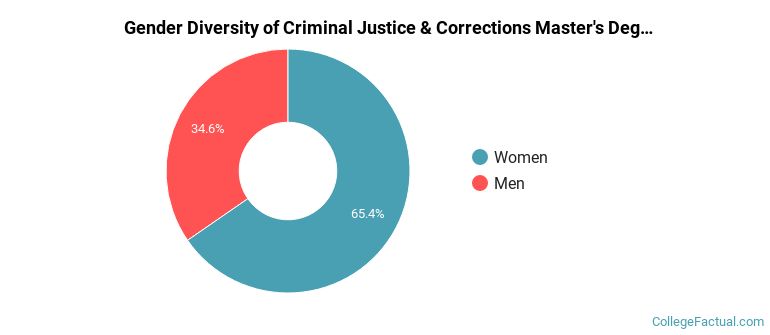
Of the 52 students who earned a master's degree in Criminal Justice & Corrections from UT Rio Grande Valley in 2021-2022, 35% were men and 65% were women.
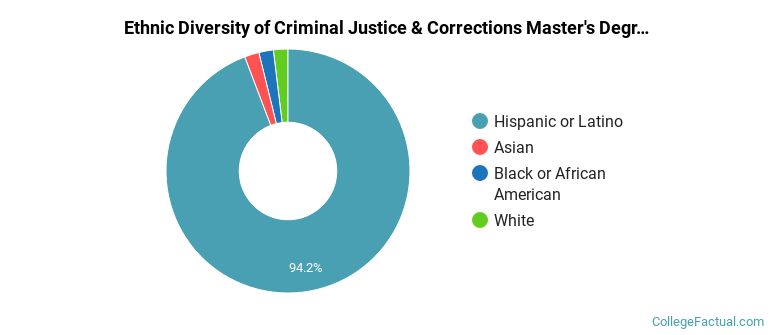
The majority of the master's degree graduates for this major are Hispanic or Latino. In the most recent graduating class for which data is available, 94% of grads fell into this category.
The following table and chart show the ethnic background for students who recently graduated from The University of Texas Rio Grande Valley with a master's in criminal justice.
| Ethnic Background | Number of Students |
|---|---|
| Asian | 1 |
| Black or African American | 1 |
| Hispanic or Latino | 49 |
| White | 1 |
| Non-Resident Aliens | 0 |
| Other Races | 0 |
Take a look at the following statistics related to the make-up of the criminal justice majors at The University of Texas Rio Grande Valley.
| Related Major | Annual Graduates |
|---|---|
| Homeland Security | 11 |