Here, you'll find out more about the major, including such details as the number of graduates, what degree levels are offered, ethnicity of students, average salaries, and more. In addition, we cover how Thomas Jefferson University ranks in comparison to other schools with business administration programs.
Jump to any of the following sections:
The bachelor's program at Thomas Jefferson University was ranked #592 on College Factual's Best Schools for business administration list. It is also ranked #31 in Pennsylvania.
During the 2021-2022 academic year, Thomas Jefferson University handed out 16 bachelor's degrees in business administration & management. This is a decrease of 36% over the previous year when 25 degrees were handed out.
In 2022, 67 students received their master’s degree in business administration from Thomas Jefferson University. This makes it the #419 most popular school for business administration master’s degree candidates in the country.
In addition, 9 students received their doctoral degrees in business administration in 2022, making the school the #62 most popular school in the United States for this category of students.
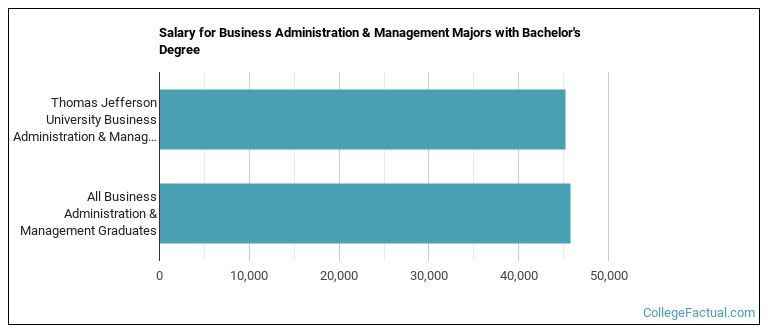
The median salary of business administration students who receive their bachelor's degree at Thomas Jefferson University is $45,225. This is less than $45,741, which is the national median of all business administration majors in the nation who earn bachelor's degrees.
In 2022-2023, the average part-time undergraduate tuition at Thomas Jefferson University was $1,396 per credit hour for both in-state and out-of-state students. The average full-time tuition and fees for undergraduates are shown in the table below.
| In State | Out of State | |
|---|---|---|
| Tuition | $44,400 | $44,400 |
| Fees | $1,133 | $1,133 |
| Books and Supplies | $1,600 | $1,600 |
| On Campus Room and Board | $17,246 | $17,246 |
| On Campus Other Expenses | $4,028 | $4,028 |
Learn more about Thomas Jefferson University tuition and fees.
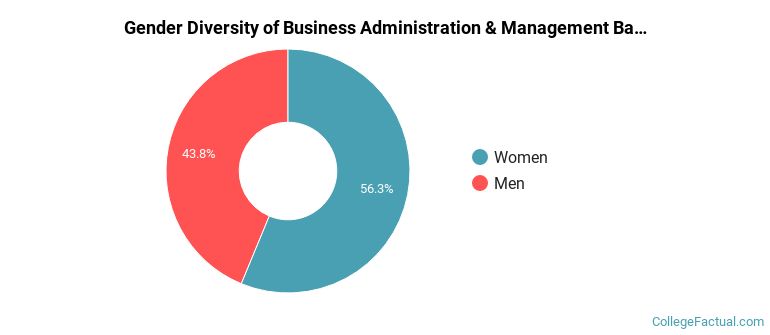
In the 2021-2022 academic year, 16 students earned a bachelor's degree in business administration from Thomas Jefferson University. About 56% of these graduates were women and the other 44% were men.
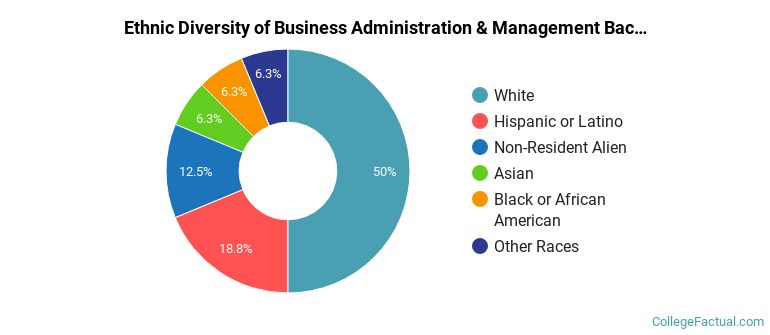
The following table and chart show the ethnic background for students who recently graduated from Thomas Jefferson University with a bachelor's in business administration.
| Ethnic Background | Number of Students |
|---|---|
| Asian | 1 |
| Black or African American | 1 |
| Hispanic or Latino | 3 |
| White | 8 |
| Non-Resident Aliens | 2 |
| Other Races | 1 |
Online degrees for the Thomas Jefferson University business administration bachelor’s degree program are not available at this time. To see if the school offers distance learning options in other areas, visit the Thomas Jefferson University Online Learning page.
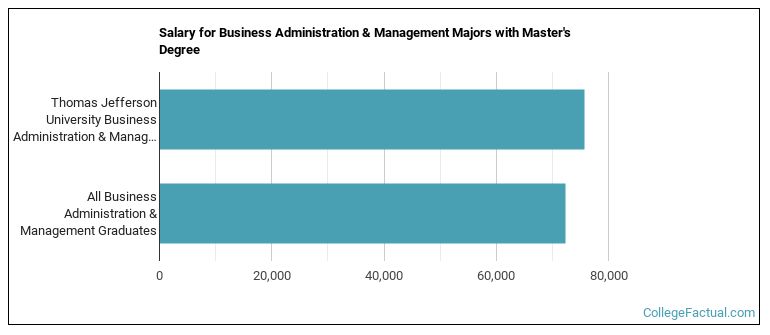
Graduates of the master's business administration program at Thomas Jefferson University make a median salary of $75,754. This is a better than average outcome since the median salary for all business administration graduates with a master's is $72,329.
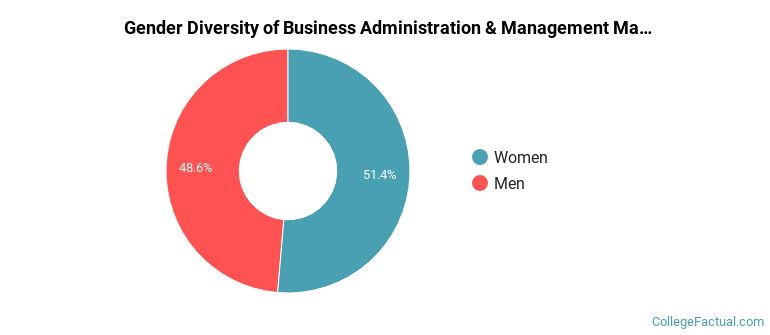
During the 2021-2022 academic year, 74 students graduated with a master's degree in business administration from Thomas Jefferson University. About 49% were men and 51% were women.
The following table and chart show the ethnic background for students who recently graduated from Thomas Jefferson University with a master's in business administration.
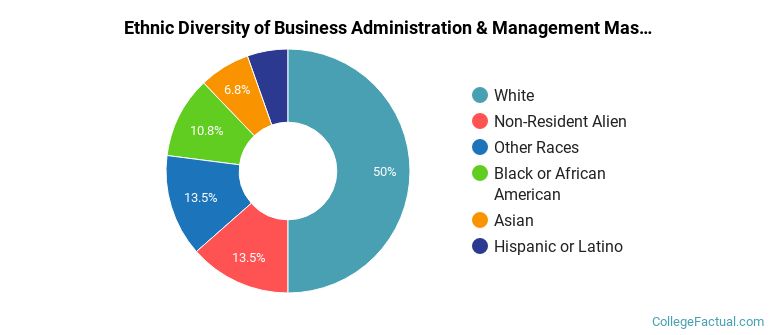
| Ethnic Background | Number of Students |
|---|---|
| Asian | 5 |
| Black or African American | 8 |
| Hispanic or Latino | 4 |
| White | 37 |
| Non-Resident Aliens | 10 |
| Other Races | 10 |
Take a look at the following statistics related to the make-up of the business administration majors at Thomas Jefferson University.
| Related Major | Annual Graduates |
|---|---|
| Specialized Sales, Merchandising & Marketing | 51 |
| Marketing | 12 |
| Human Resource Management | 7 |
| Finance & Financial Management | 6 |
| Taxation | 6 |
View All Business Administration & Management Related Majors >
More about our data sources and methodologies.