Thomas More total enrollment is approximately 2,037 students. 1,323 are undergraduates and 71 are graduate students.
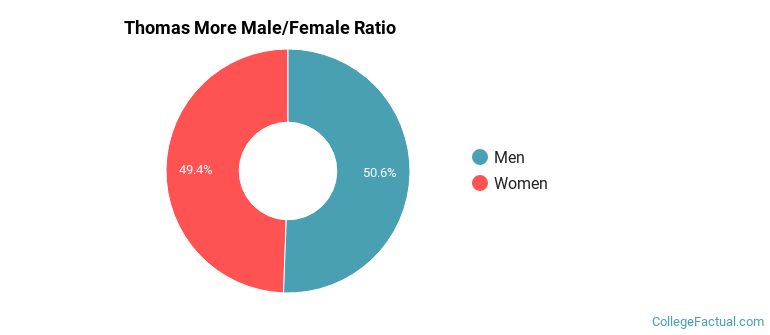
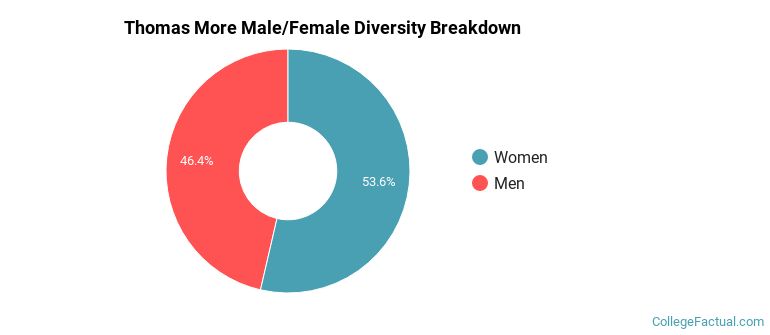
Male/Female Breakdown of Undergraduates
The full-time Thomas More undergraduate population is made up of 48% women, and 52% men.
For the gender breakdown for all students, go here.
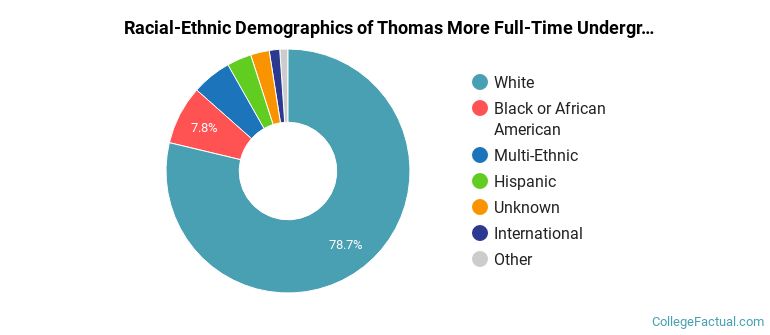
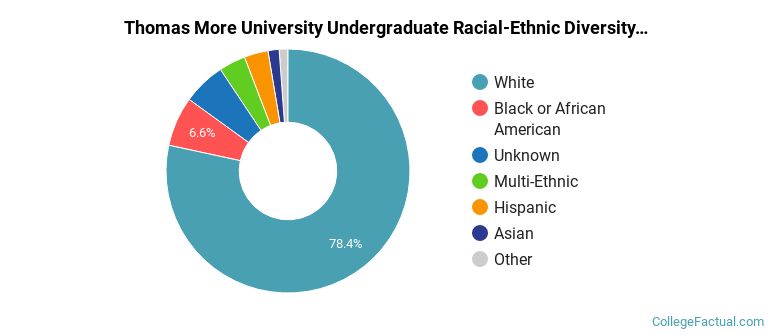
Thomas More Racial/Ethnic Breakdown of Undergraduates
| Race/Ethnicity | Number |
|---|---|
| White | 1,005 |
| Black or African American | 112 |
| Multi-Ethnic | 65 |
| Unknown | 55 |
| Hispanic | 47 |
| International | 25 |
| Asian | 12 |
| Native Hawaiian or Pacific Islander | 1 |
See racial/ethnic breakdown for all students.
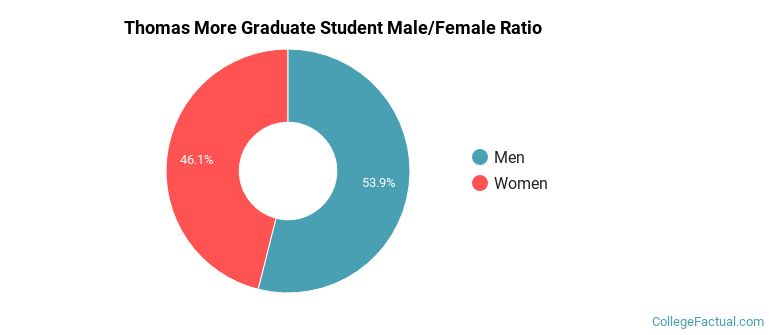
Male/Female Breakdown of Graduate Students
About 48% of full-time grad students are women, and 52% men.
For the gender breakdown for all students, go here.
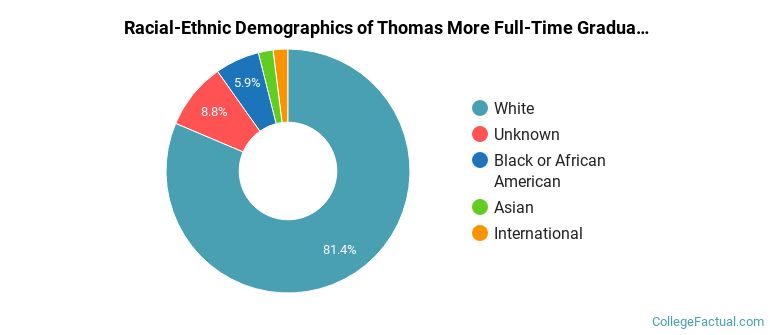
Thomas More Racial-Ethnic Breakdown of Graduate Students
| Race/Ethnicity | Number |
|---|---|
| White | 52 |
| Black or African American | 7 |
| Unknown | 4 |
| Multi-Ethnic | 3 |
| Hispanic | 2 |
| Asian | 1 |
| Native Hawaiian or Pacific Islander | 1 |
| International | 1 |
See racial/ethnic breakdown for all students.
| Race/Ethnicity | Number |
|---|---|
| White | 1,556 |
| Black or African American | 152 |
| Unknown | 134 |
| Multi-Ethnic | 83 |
| Hispanic | 63 |
| International | 26 |
| Asian | 19 |
| Native Hawaiian or Pacific Islander | 2 |
There are approximately 1,059 female students and 978 male students at Thomas More.
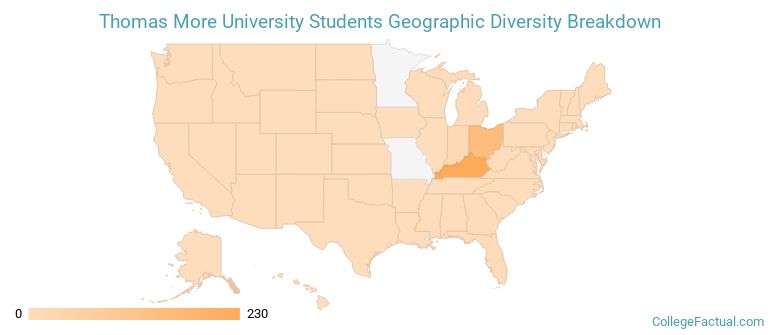
Thomas More ranks 1,005 out of 2,183 when it comes to geographic diversity.
44.44% of Thomas More students come from out of state, and 0% come from out of the country.
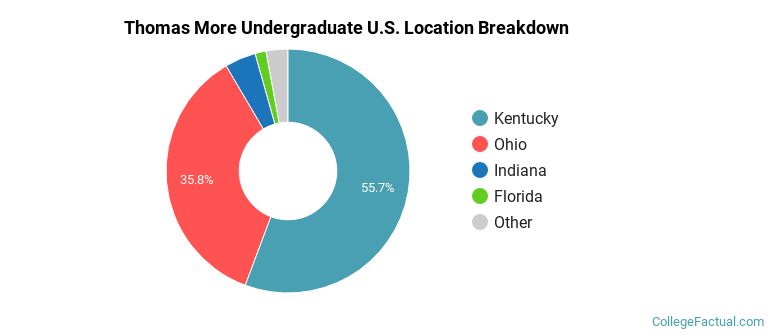
The undergraduate student body is split among 11 states (may include Washington D.C.). Click on the map for more detail.
| State | Amount |
|---|---|
| Kentucky | 230 |
| Ohio | 148 |
| Indiana | 17 |
| Florida | 6 |
| Georgia | 4 |
Students from 6 countries are represented at this school, with the majority of the international students coming from Kenya, Germany, and United Kingdom.
Learn more about international students at Thomas More.
A traditional college student is defined as being between the ages of 18-21. At Thomas More, 48.06% of students fall into that category, compared to the national average of 60%.
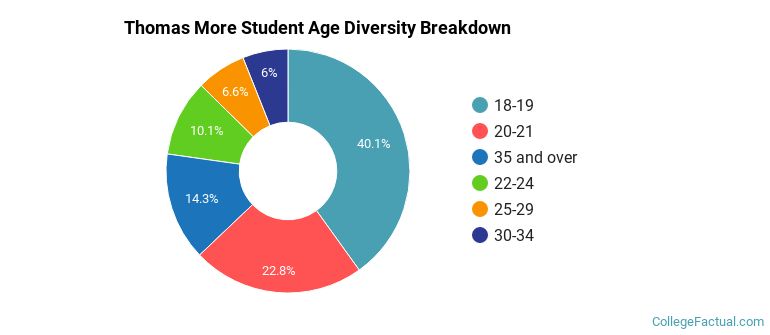
| Student Age Group | Amount |
|---|---|
| 18-19 | 632 |
| 20-21 | 360 |
| 35 and over | 226 |
| 22-24 | 160 |
| 25-29 | 104 |
| 30-34 | 95 |
| Under 18 | 0 |
Footnotes
*The racial-ethnic minorities count is calculated by taking the total number of students and subtracting white students, international students, and students whose race/ethnicity was unknown. This number is then divided by the total number of students at the school to obtain the racial-ethnic minorities percentage.
References
Department of Homeland Security Citizenship and Immigration Services
Image Credit: By John Phelan under License
Learn more about how College Factual creates their Diversity Rankings.