Explore the best ranked schools for the programs you are most interested in.
Trine landed the #2,146 spot in College Factual's 2025 ranking of best overall colleges in the United States. The higher ed experts analyzed 2,152 colleges and universities across the nation to determine this ranking. This is an improvement over the previous year, when Trine held the #2,177 spot on the Best Overall Colleges list.
Trine is also ranked #41 out of 41 schools in Indiana.
See all of the rankings for Trine University-Regional/Non-Traditional Campuses.
Even if you have the best grades and high test scores, that may not be enough to get into Trine since the school has one of the most selective in the country. Its acceptance rate is a mere 24%, so there's no shame if you don't get in. Be sure to apply to other schools just in case.
At Trine, the student to faculty ratio is an excellent 8 to 1. That's much better than the national average of 15 to 1. This indicates that many classes will probably be small, and students will have ample opportunites to work closely with their professors and classmates.
Another measure that is often used to estimate how much access students will have to their professors is how many faculty members are full-time. The idea here is that part-time faculty tend to spend less time on campus, so they may not be as available to students as full-timers.
The full-time faculty percentage at Trine University-Regional/Non-Traditional Campuses is 32%. This is lower than the national average of 47%.
During the 2017-2018 academic year, there were 334 undergraduates at Trine with 152 being full-time and 182 being part-time.
The net price is calculated by adding tuition, room, board and other costs and subtracting financial aid.Note that the net price is typically less than the published for a school. For more information on the sticker price of Trine, see our tuition and fees and room and board pages.
It's not uncommon for college students to take out loans to pay for school. In fact, almost 66% of students nationwide depend at least partially on loans. At Trine, approximately 100% of students took out student loans averaging $4,750 a year. That adds up to $19,000 over four years for those students.
Get more details about paying for Trine University-Regional/Non-Traditional Campuses.
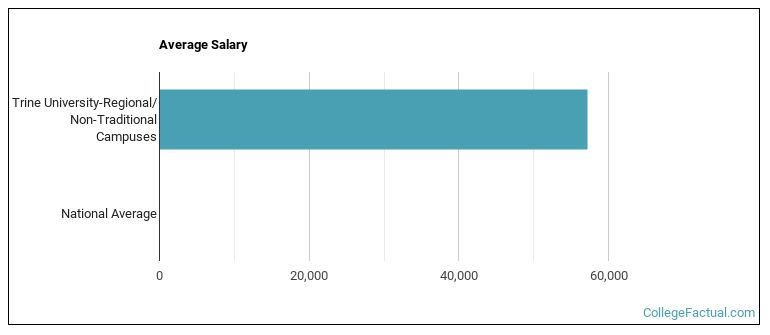
See which majors at Trine University-Regional/Non-Traditional Campuses make the most money.
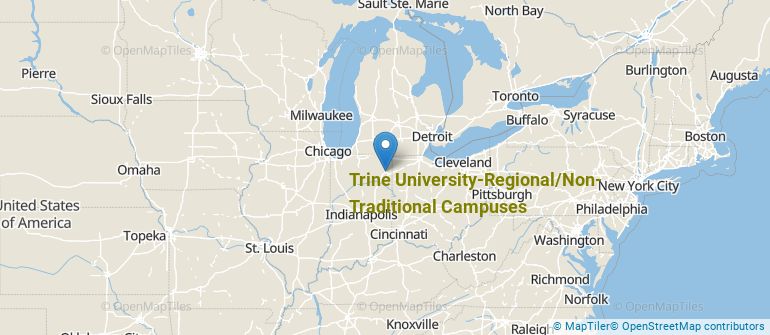
Get more details about the location of Trine University-Regional/Non-Traditional Campuses.
Contact details for Trine are given below.
| Contact Details | |
|---|---|
| Address: | 1 University Avenue, Angola, IN 46703 |
| Phone: | 260-483-4949 |
| Website: | trine.edu/online/index.aspx |
| Facebook: | https://www.facebook.com/TrineUniversity |
| Twitter: | https://twitter.com/trineuniversity |
| Most Popular Majors | Bachelor’s Degrees | Average Salary of Graduates |
|---|---|---|
| Business Administration & Management | 161 | $43,504 |
| Health & Medical Administrative Services | 161 | NA |
| Information Science | 71 | NA |
| Data Analytics | 26 | NA |
| Engineering-Related Fields | 15 | NA |
| Criminal Justice & Corrections | 15 | $31,114 |
| General Psychology | 15 | $37,096 |
| Accounting | 11 | $45,913 |
| Industrial Production Technology | 8 | NA |
| Human Resource Management | 6 | NA |
Online learning is becoming popular at even the oldest colleges and universities in the United States. Not only are online classes great for returning adults with busy schedules, they are also frequented by a growing number of traditional students.
In 2022-2023, 4,237 students took at least one online class at Trine University-Regional/Non-Traditional Campuses. This is an increase from the 1,331 students who took online classes the previous year.
| Year | Took at Least One Online Class | Took All Classes Online |
|---|---|---|
| 2022-2023 | 4,237 | 678 |
| 2021-2022 | 1,331 | 560 |
| 2020-2021 | 1,040 | 449 |
| 2018-2019 | 606 | 358 |
Learn more about online learning at Trine University-Regional/Non-Traditional Campuses.
Footnotes
*The racial-ethnic minorities count is calculated by taking the total number of students and subtracting white students, international students, and students whose race/ethnicity was unknown. This number is then divided by the total number of students at the school to obtain the racial-ethnic minorities percentage.
References
More about our data sources and methodologies.