TROY total enrollment is approximately 16,497 students. 8,208 are undergraduates and 1,219 are graduate students.
Male/Female Breakdown of Undergraduates
The full-time TROY undergraduate population is made up of 63% women, and 37% men.

For the gender breakdown for all students, go here.
TROY Racial/Ethnic Breakdown of Undergraduates

| Race/Ethnicity | Number |
|---|---|
| White | 4,669 |
| Black or African American | 2,304 |
| Hispanic | 319 |
| Multi-Ethnic | 316 |
| Unknown | 257 |
| International | 245 |
| Asian | 64 |
| Native Hawaiian or Pacific Islander | 7 |
See racial/ethnic breakdown for all students.
Male/Female Breakdown of Graduate Students
About 73% of full-time grad students are women, and 27% men.

For the gender breakdown for all students, go here.
TROY Racial-Ethnic Breakdown of Graduate Students

| Race/Ethnicity | Number |
|---|---|
| White | 540 |
| Black or African American | 438 |
| Unknown | 101 |
| Hispanic | 56 |
| International | 38 |
| Multi-Ethnic | 36 |
| Asian | 7 |
| Native Hawaiian or Pacific Islander | 0 |
See racial/ethnic breakdown for all students.

| Race/Ethnicity | Number |
|---|---|
| White | 8,302 |
| Black or African American | 5,149 |
| Unknown | 1,124 |
| Hispanic | 758 |
| Multi-Ethnic | 597 |
| International | 330 |
| Asian | 163 |
| Native Hawaiian or Pacific Islander | 21 |

There are approximately 10,374 female students and 6,123 male students at TROY.
TROY ranks 790 out of 2,183 when it comes to geographic diversity.
23.37% of TROY students come from out of state, and 7.29% come from out of the country.
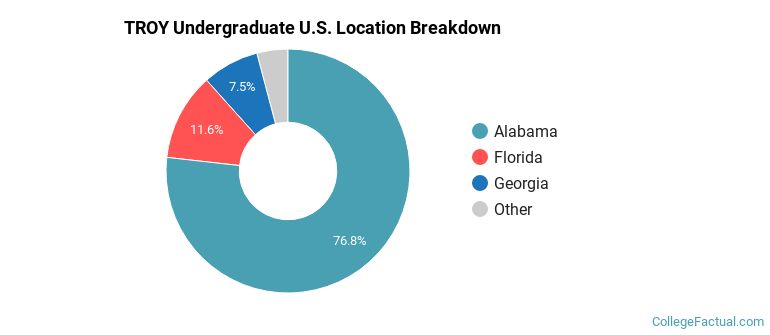
The undergraduate student body is split among 30 states (may include Washington D.C.). Click on the map for more detail.

| State | Amount |
|---|---|
| Alabama | 1,379 |
| Florida | 208 |
| Georgia | 135 |
| North Carolina | 8 |
| Texas | 8 |
Students from 78 countries are represented at this school, with the majority of the international students coming from China, India, and Nepal.
Learn more about international students at TROY.
A traditional college student is defined as being between the ages of 18-21. At TROY, 34.91% of students fall into that category, compared to the national average of 60%.

| Student Age Group | Amount |
|---|---|
| 35 and over | 3,531 |
| 18-19 | 3,228 |
| 20-21 | 2,888 |
| 25-29 | 2,320 |
| 22-24 | 2,181 |
| 30-34 | 1,720 |
| Under 18 | 0 |
Footnotes
*The racial-ethnic minorities count is calculated by taking the total number of students and subtracting white students, international students, and students whose race/ethnicity was unknown. This number is then divided by the total number of students at the school to obtain the racial-ethnic minorities percentage.
References