Tulane total enrollment is approximately 13,927 students. 7,851 are undergraduates and 3,296 are graduate students.
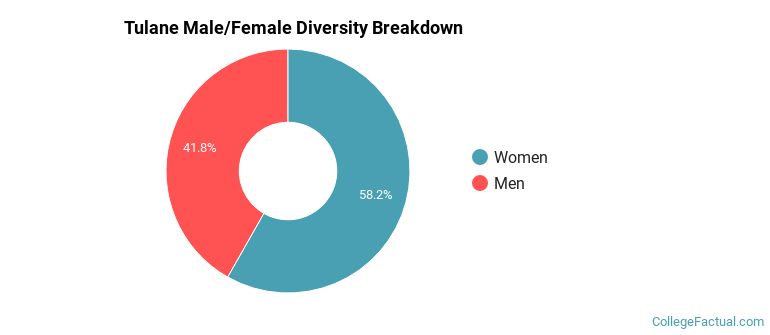
Male/Female Breakdown of Undergraduates
The full-time Tulane undergraduate population is made up of 61% women, and 39% men.
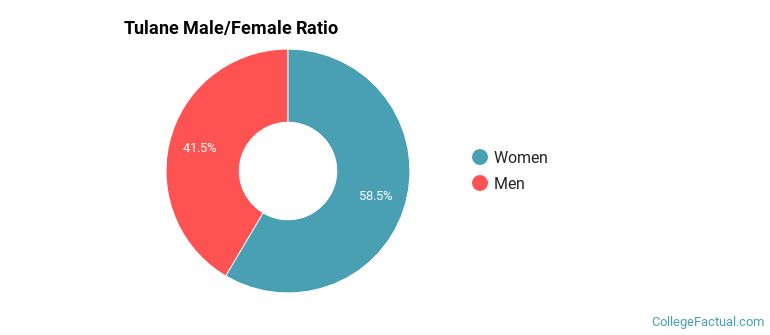
For the gender breakdown for all students, go here.
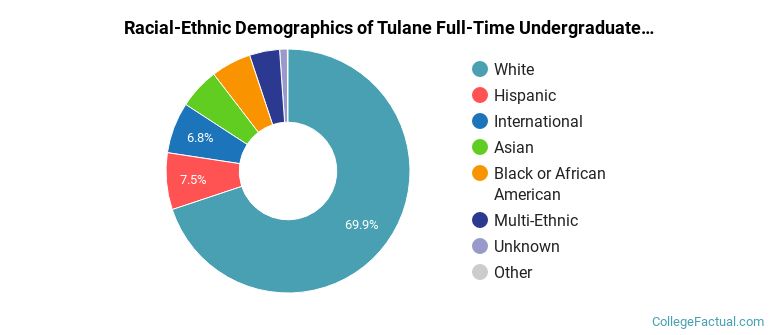
Tulane Racial/Ethnic Breakdown of Undergraduates
| Race/Ethnicity | Number |
|---|---|
| White | 5,542 |
| Hispanic | 649 |
| International | 437 |
| Asian | 421 |
| Black or African American | 395 |
| Multi-Ethnic | 318 |
| Unknown | 72 |
| Native Hawaiian or Pacific Islander | 6 |
See racial/ethnic breakdown for all students.
Male/Female Breakdown of Graduate Students
About 59% of full-time grad students are women, and 41% men.

For the gender breakdown for all students, go here.
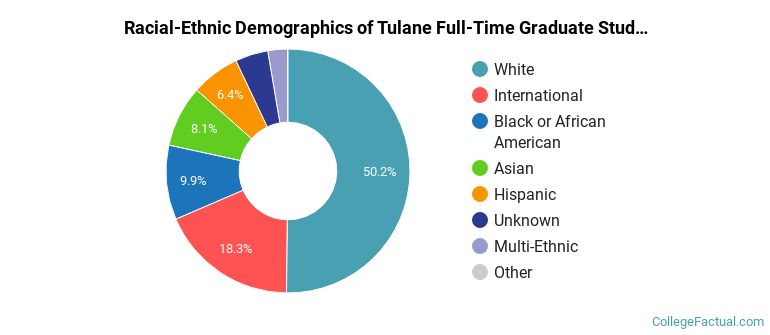
Tulane Racial-Ethnic Breakdown of Graduate Students
| Race/Ethnicity | Number |
|---|---|
| White | 1,788 |
| International | 411 |
| Black or African American | 366 |
| Asian | 273 |
| Hispanic | 249 |
| Unknown | 131 |
| Multi-Ethnic | 68 |
| Native Hawaiian or Pacific Islander | 1 |
See racial/ethnic breakdown for all students.
| Race/Ethnicity | Number |
|---|---|
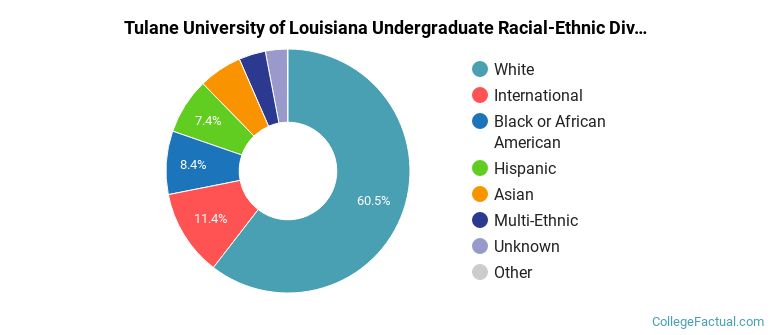
| White | 8,560 |
| International | 1,394 |
| Black or African American | 1,194 |
| Hispanic | 1,116 |
| Asian | 761 |
| Multi-Ethnic | 442 |
| Unknown | 420 |
| Native Hawaiian or Pacific Islander | 11 |
There are approximately 8,391 female students and 5,536 male students at Tulane.
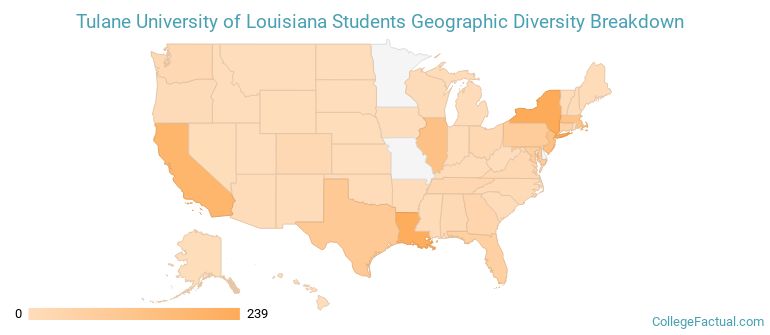
Tulane ranks 56 out of 2,183 when it comes to geographic diversity.
83.51% of Tulane students come from out of state, and 0.22% come from out of the country.
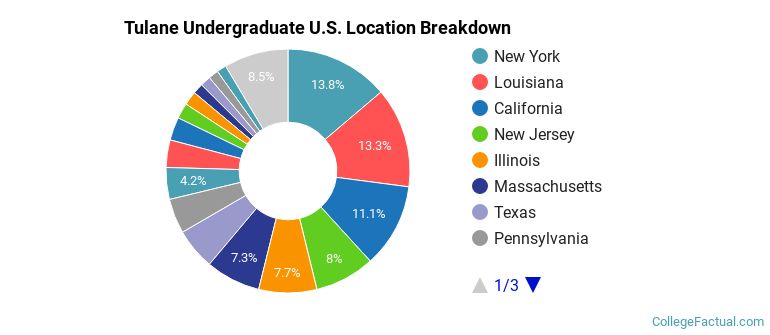
The undergraduate student body is split among 43 states (may include Washington D.C.). Click on the map for more detail.
| State | Amount |
|---|---|
| New York | 239 |
| Louisiana | 230 |
| California | 193 |
| New Jersey | 138 |
| Illinois | 133 |
Students from 92 countries are represented at this school, with the majority of the international students coming from China, India, and Canada.
Learn more about international students at Tulane.
A traditional college student is defined as being between the ages of 18-21. At Tulane, 51.96% of students fall into that category, compared to the national average of 60%.
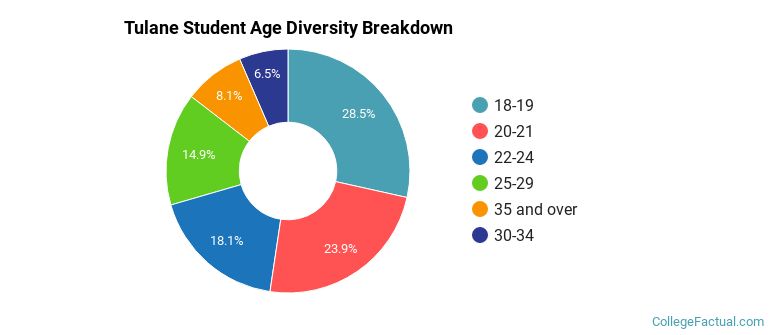
| Student Age Group | Amount |
|---|---|
| 18-19 | 3,501 |
| 20-21 | 2,934 |
| 22-24 | 2,230 |
| 25-29 | 1,835 |
| 35 and over | 992 |
| 30-34 | 798 |
| Under 18 | 0 |
Footnotes
*The racial-ethnic minorities count is calculated by taking the total number of students and subtracting white students, international students, and students whose race/ethnicity was unknown. This number is then divided by the total number of students at the school to obtain the racial-ethnic minorities percentage.
References
Department of Homeland Security Citizenship and Immigration Services
Image Credit: By bsulldiesel under License
Learn more about how College Factual creates their Diversity Rankings.