Explore the best ranked schools for the programs you are most interested in.
TMCC was not ranked in College Factual's 2025 Best Overall Colleges report. This could be for a number of reasons, including lack of data.
See all of the rankings for Turtle Mountain Community College.
If you are worried about getting into Turtle Mountain Community College, don't be. The school has a liberal open admissions policy, which means you only need to meet basic requirements in order to be admitted. Still, be sure to submit a complete application and provide any other requested materials.
At TMCC, the student to faculty ratio is an excellent 10 to 1. That's much better than the national average of 15 to 1. This indicates that many classes will probably be small, and students will have ample opportunites to work closely with their professors and classmates.
In addition to the student to faculty ratio, some people look at what percentage of faculty members are full-time as a sign of how much time professors will be able to spend with their students. This is because part-time teachers may not be be on campus as much as their full-time counterparts.
The full-time faculty percentage at Turtle Mountain Community College is 67%. This is higher than the national average of 47%.
The freshmen retention rate tells us what percentage of first-year, full-time students choose to continue on to their sophomore year at a particular school. The rate at Turtle Mountain Community College is 67%, which is about average when compared to the national rate of 68%.
When we say that a student has graduated on time, we mean that they have finished their bachelor's degree within four years. The on-time graduation rate at TMCC is 17%. That's lower than the national rate of 33.3%
Find out more about the retention and graduation rates at Turtle Mountain Community College.
During the 2017-2018 academic year, there were 586 undergraduates at TMCC with 471 being full-time and 115 being part-time.
The net price is calculated by adding tuition, room, board and other costs and subtracting financial aid.Note that the net price is typically less than the published for a school. For more information on the sticker price of TMCC, see our tuition and fees and room and board pages.
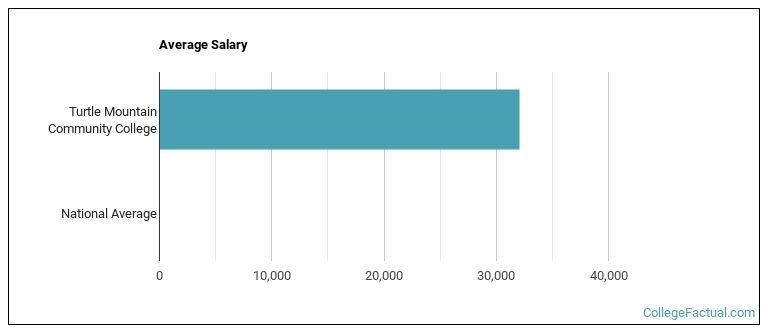
See which majors at Turtle Mountain Community College make the most money.
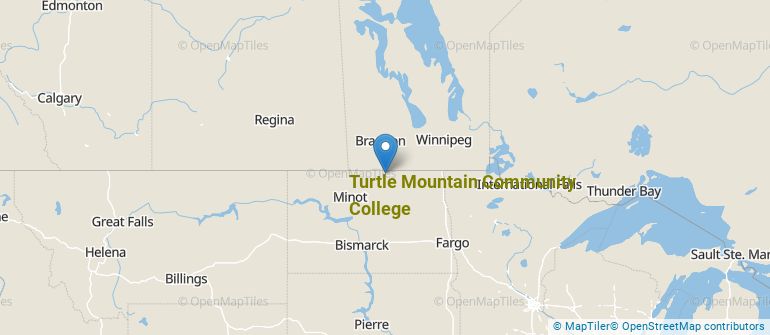
Get more details about the location of Turtle Mountain Community College.
Contact details for TMCC are given below.
| Contact Details | |
|---|---|
| Address: | 10145 Bia #7, Belcourt, ND 58316 |
| Phone: | 701-477-7862 |
| Website: | www.tm.edu/ |
| Most Popular Majors | Bachelor’s Degrees | Average Salary of Graduates |
|---|---|---|
| Liberal Arts General Studies | 64 | NA |
| Ground Transportation | 25 | NA |
| Industrial Production Technology | 24 | NA |
| Health Sciences & Services | 13 | NA |
| Other Business, Management & Marketing | 10 | NA |
| Construction | 8 | NA |
| Allied Health & Medical Assisting Services | 7 | NA |
| Health & Physical Education | 7 | NA |
| Precision Metal Working | 7 | NA |
| Health & Medical Administrative Services | 6 | NA |
Online learning options are becoming more and more popular at American colleges and universities. Online classes are great for students who have busy schedules or for those who just want to study on their own time.
In 2022-2023, 421 students took at least one online class at Turtle Mountain Community College. This is an increase from the 261 students who took online classes the previous year.
| Year | Took at Least One Online Class | Took All Classes Online |
|---|---|---|
| 2022-2023 | 421 | 121 |
| 2021-2022 | 261 | 38 |
| 2020-2021 | 586 | 586 |
| 2018-2019 | 295 | 3 |
Learn more about online learning at Turtle Mountain Community College.
If you’re considering Turtle Mountain Community College, here are some more schools you may be interested in knowing more about.
Curious on how these schools stack up against TMCC? Pit them head to head with College Combat, our free interactive tool that lets you compare college on the features that matter most to you!
Footnotes
*The racial-ethnic minorities count is calculated by taking the total number of students and subtracting white students, international students, and students whose race/ethnicity was unknown. This number is then divided by the total number of students at the school to obtain the racial-ethnic minorities percentage.
References
More about our data sources and methodologies.