Tusculum total enrollment is approximately 1,664 students. 1,090 are undergraduates and 225 are graduate students.
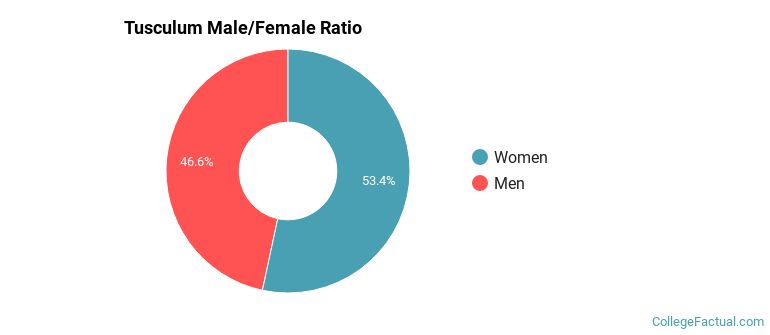
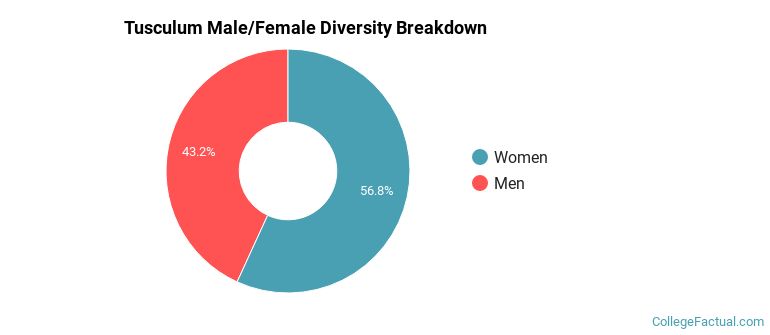
Male/Female Breakdown of Undergraduates
The full-time Tusculum undergraduate population is made up of 55% women, and 45% men.
For the gender breakdown for all students, go here.
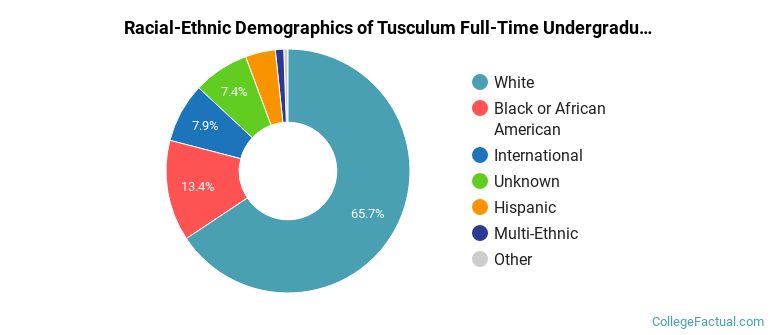
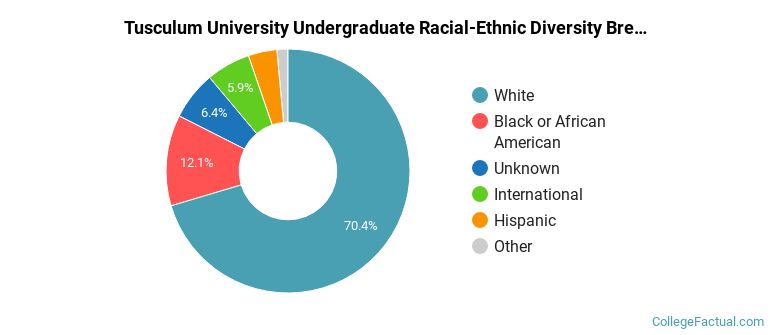
Tusculum Racial/Ethnic Breakdown of Undergraduates
| Race/Ethnicity | Number |
|---|---|
| White | 672 |
| Unknown | 174 |
| Black or African American | 119 |
| International | 61 |
| Hispanic | 37 |
| Multi-Ethnic | 17 |
| Asian | 2 |
| Native Hawaiian or Pacific Islander | 1 |
See racial/ethnic breakdown for all students.
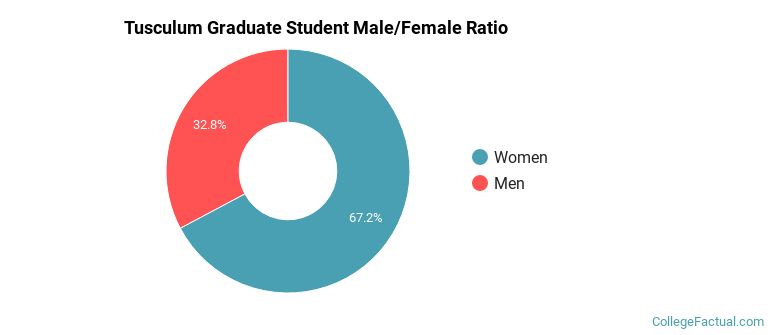
Male/Female Breakdown of Graduate Students
About 67% of full-time grad students are women, and 33% men.
For the gender breakdown for all students, go here.
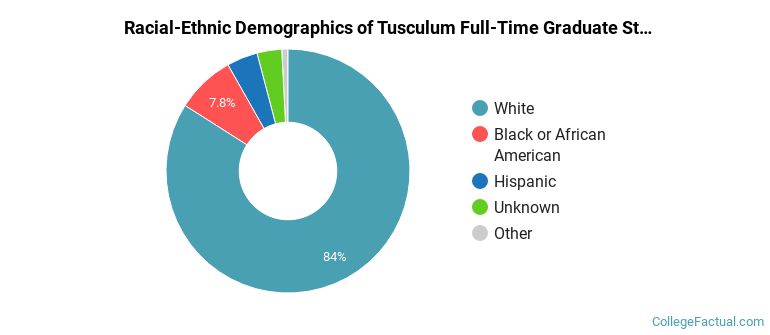
Tusculum Racial-Ethnic Breakdown of Graduate Students
| Race/Ethnicity | Number |
|---|---|
| White | 190 |
| Black or African American | 14 |
| Unknown | 9 |
| International | 6 |
| Hispanic | 4 |
| Native Hawaiian or Pacific Islander | 1 |
| Multi-Ethnic | 1 |
| Asian | 0 |
See racial/ethnic breakdown for all students.
| Race/Ethnicity | Number |
|---|---|
| White | 1,128 |
| Unknown | 229 |
| Black or African American | 153 |
| International | 69 |
| Hispanic | 46 |
| Multi-Ethnic | 22 |
| Asian | 6 |
| Native Hawaiian or Pacific Islander | 3 |
There are approximately 983 female students and 681 male students at Tusculum.
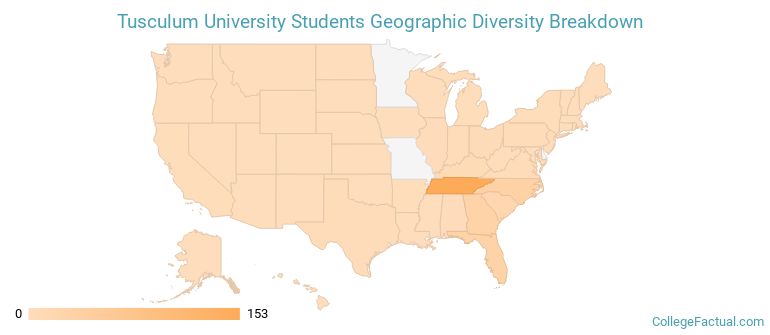
Tusculum ranks 655 out of 2,183 when it comes to geographic diversity.
50.49% of Tusculum students come from out of state, and 0% come from out of the country.
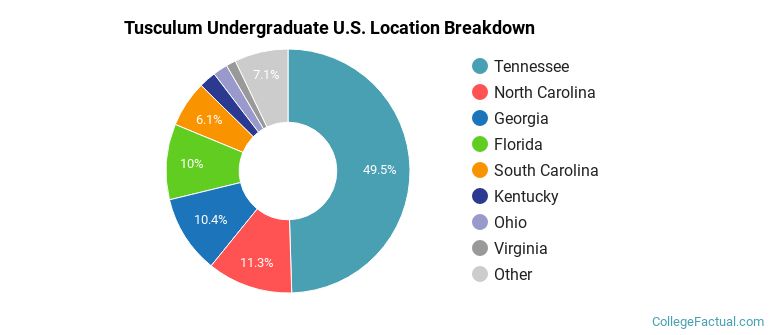
The undergraduate student body is split among 20 states (may include Washington D.C.). Click on the map for more detail.
| State | Amount |
|---|---|
| Tennessee | 153 |
| North Carolina | 35 |
| Georgia | 32 |
| Florida | 31 |
| South Carolina | 19 |
Students from 36 countries are represented at this school, with the majority of the international students coming from Canada, Spain, and United Kingdom.
Learn more about international students at Tusculum.
A traditional college student is defined as being between the ages of 18-21. At Tusculum, 50.03% of students fall into that category, compared to the national average of 60%.
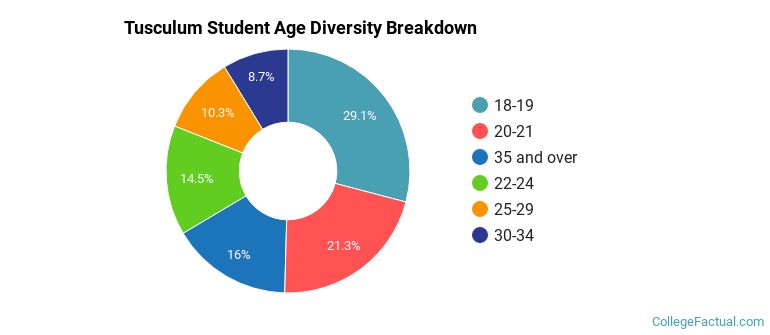
| Student Age Group | Amount |
|---|---|
| 18-19 | 510 |
| 20-21 | 374 |
| 35 and over | 281 |
| 22-24 | 255 |
| 25-29 | 180 |
| 30-34 | 153 |
| Under 18 | 0 |
Footnotes
*The racial-ethnic minorities count is calculated by taking the total number of students and subtracting white students, international students, and students whose race/ethnicity was unknown. This number is then divided by the total number of students at the school to obtain the racial-ethnic minorities percentage.
References