Union total enrollment is approximately 809 students. 227 are undergraduates and 146 are graduate students.
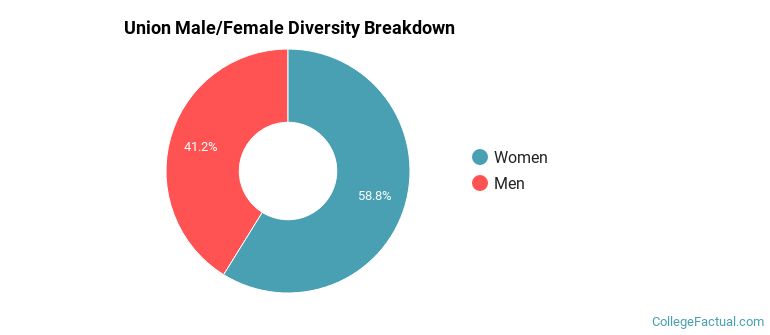
Male/Female Breakdown of Undergraduates
The full-time Union undergraduate population is made up of 49% women, and 51% men.
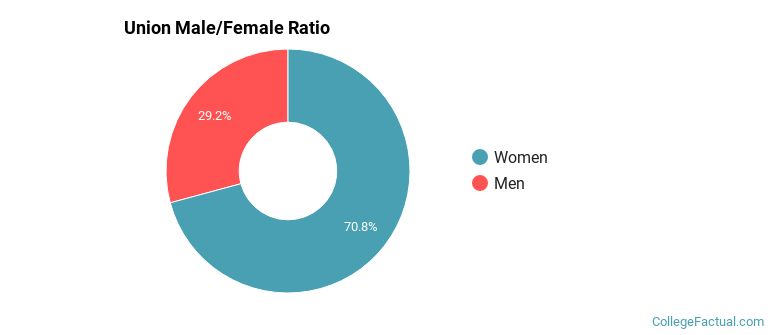
For the gender breakdown for all students, go here.
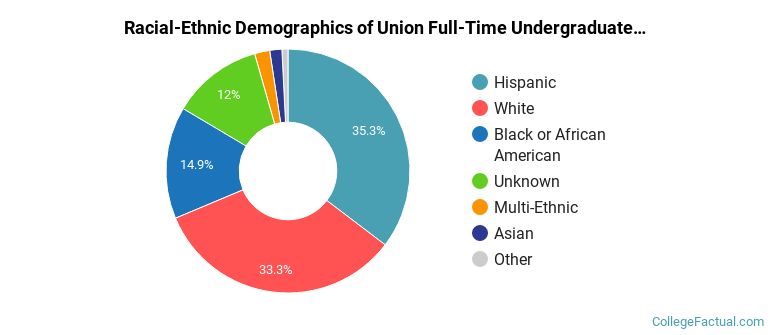
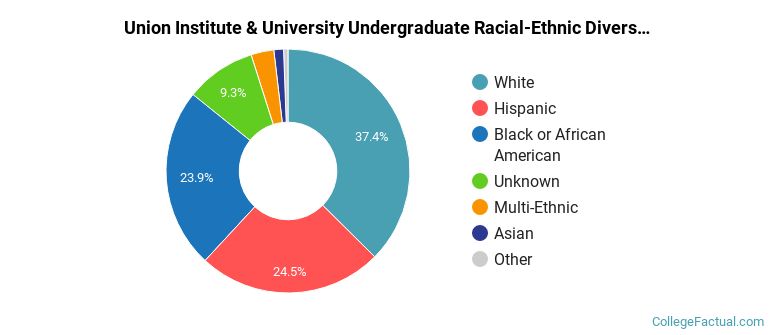
Union Racial/Ethnic Breakdown of Undergraduates
| Race/Ethnicity | Number |
|---|---|
| White | 71 |
| Hispanic | 64 |
| Black or African American | 46 |
| Unknown | 34 |
| Asian | 4 |
| Multi-Ethnic | 4 |
| Native Hawaiian or Pacific Islander | 2 |
| International | 0 |
See racial/ethnic breakdown for all students.
Male/Female Breakdown of Graduate Students
About 57% of full-time grad students are women, and 43% men.
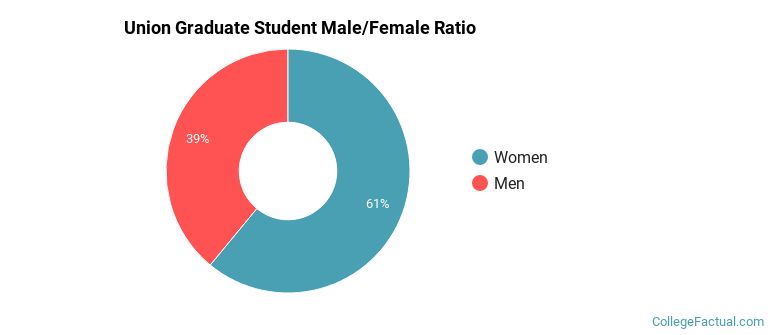
For the gender breakdown for all students, go here.
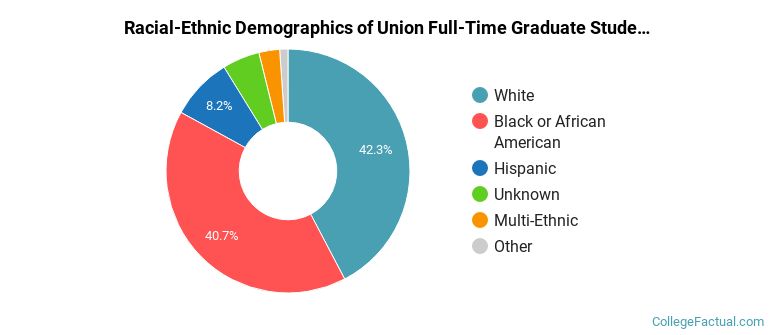
Union Racial-Ethnic Breakdown of Graduate Students
| Race/Ethnicity | Number |
|---|---|
| White | 58 |
| Black or African American | 57 |
| Hispanic | 13 |
| Unknown | 9 |
| Multi-Ethnic | 7 |
| Asian | 1 |
| Native Hawaiian or Pacific Islander | 1 |
| International | 0 |
See racial/ethnic breakdown for all students.
| Race/Ethnicity | Number |
|---|---|
| White | 311 |
| Black or African American | 184 |
| Hispanic | 175 |
| Unknown | 86 |
| Multi-Ethnic | 28 |
| Asian | 16 |
| Native Hawaiian or Pacific Islander | 5 |
| International | 0 |
There are approximately 405 female students and 404 male students at Union.
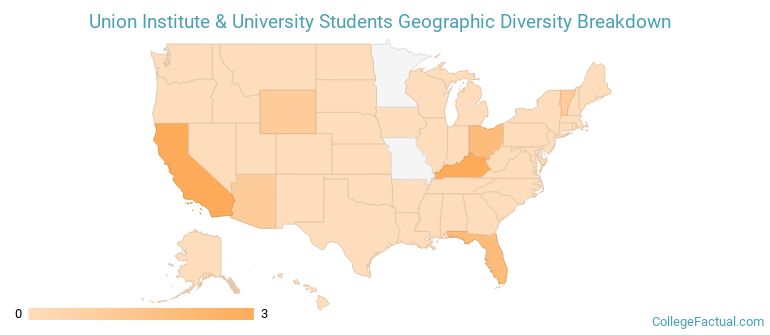
Union ranks 390 out of 2,183 when it comes to geographic diversity.
84.62% of Union students come from out of state, and 0% come from out of the country.
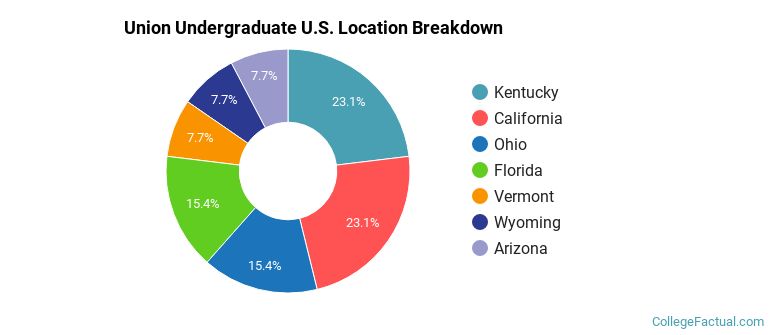
The undergraduate student body is split among 7 states (may include Washington D.C.). Click on the map for more detail.
| State | Amount |
|---|---|
| California | 3 |
| Kentucky | 3 |
| Florida | 2 |
| Ohio | 2 |
| Arizona | 1 |
A traditional college student is defined as being between the ages of 18-21. At Union, 1.01% of students fall into that category, compared to the national average of 60%.
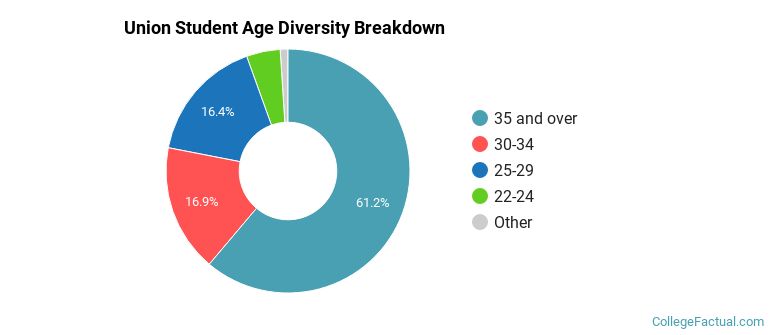
| Student Age Group | Amount |
|---|---|
| 35 and over | 655 |
| 30-34 | 181 |
| 25-29 | 176 |
| 22-24 | 48 |
| 20-21 | 10 |
| 18-19 | 1 |
| Under 18 | 0 |
Footnotes
*The racial-ethnic minorities count is calculated by taking the total number of students and subtracting white students, international students, and students whose race/ethnicity was unknown. This number is then divided by the total number of students at the school to obtain the racial-ethnic minorities percentage.
References
Department of Homeland Security Citizenship and Immigration Services
Image Credit: By Tim Evanson under License
Find out how College Factual created their Diversity Rankings.