Explore the best ranked schools for the programs you are most interested in.
Universidad Politecnica de Puerto Rico was not ranked in College Factual's 2025 Best Overall Colleges report. This could be for a number of reasons, including lack of data.
See all of the rankings for Universidad Politecnica de Puerto Rico.
If you are worried about getting into Universidad Politecnica de Puerto Rico, don't be. The school has a liberal open admissions policy, which means you only need to meet basic requirements in order to be admitted. Still, be sure to submit a complete application and provide any other requested materials.
The student to faculty ratio is often used to estimate how much interaction there is between professors and their students at a college or university. At Universidad Politecnica de Puerto Rico, this ratio is 18 to 1, which is on par with the national average of 15 to 1. That's not bad at all.
In addition to the student to faculty ratio, some people look at what percentage of faculty members are full-time as a sign of how much time professors will be able to spend with their students. This is because part-time teachers may not be be on campus as much as their full-time counterparts.
The full-time faculty percentage at Universidad Politecnica de Puerto Rico is 67%. This is higher than the national average of 47%.
The freshmen retention rate of 77% tells us that most first-year, full-time students like Universidad Politecnica de Puerto Rico enough to come back for another year. This is a fair bit higher than the national average of 68%. That's certainly something to check off in the good column about the school.
The on-time graduation rate is the percent of first-time, full time students who obtain their bachelor's degree in four years or less. This rate is 2% for first-time, full-time students at Universidad Politecnica de Puerto Rico, which is lower than the national rate of 33.3%.
Find out more about the retention and graduation rates at Universidad Politecnica de Puerto Rico.
During the 2017-2018 academic year, there were 3,718 undergraduates at Universidad Politecnica de Puerto Rico with 1,777 being full-time and 1,941 being part-time.
| $0-30 K | $30K-48K | $48-75 | $75-110K | $110K + |
|---|---|---|---|---|
| $14,638 | $16,007 | $18,316 | $20,742 | $20,649 |
The net price is calculated by adding tuition, room, board and other costs and subtracting financial aid.Note that the net price is typically less than the published for a school. For more information on the sticker price of Universidad Politecnica de Puerto Rico, see our tuition and fees and room and board pages.
Almost 66% of college students who graduated with the class of 2018 took out student loans, but that percentage varies from school to school. At Universidad Politecnica de Puerto Rico, approximately 20% of students took out student loans averaging $4,017 a year. That adds up to $16,068 over four years for those students.
Get more details about paying for Universidad Politecnica de Puerto Rico.
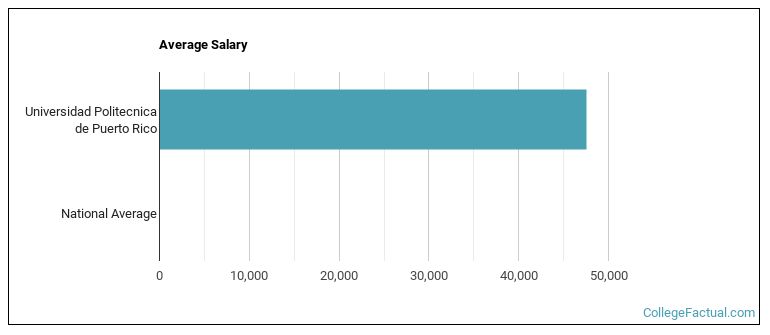
See which majors at Universidad Politecnica de Puerto Rico make the most money.
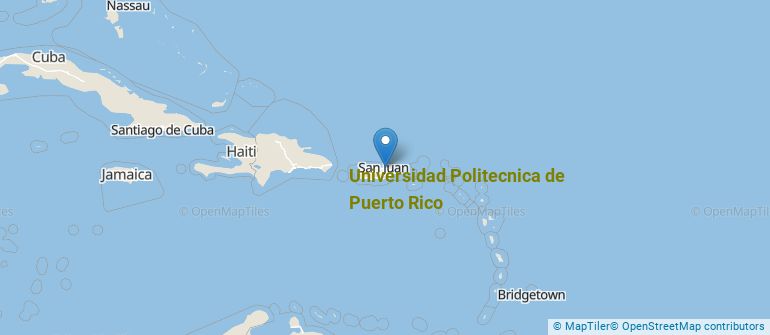
Get more details about the location of Universidad Politecnica de Puerto Rico.
Contact details for Universidad Politecnica de Puerto Rico are given below.
| Contact Details | |
|---|---|
| Address: | 377 Ponce De Leon Ave, Hato Rey, PR 00919 |
| Phone: | 787-622-8000 |
| Website: | www.pupr.edu/ |
| Most Popular Majors | Bachelor’s Degrees | Average Salary of Graduates |
|---|---|---|
| Mechanical Engineering | 84 | NA |
| Electrical Engineering | 69 | NA |
| Biomedical Engineering | 64 | NA |
| Engineering-Related Fields | 57 | NA |
| Computer Engineering | 51 | $38,213 |
| Computer Information Systems | 48 | NA |
| Industrial Engineering | 46 | NA |
| Business Administration & Management | 34 | NA |
| Industrial Production Technology | 31 | NA |
| Civil Engineering | 31 | NA |
Online learning options are becoming more and more popular at American colleges and universities. Online classes are great for students who have busy schedules or for those who just want to study on their own time.
In 2022-2023, 2,311 students took at least one online class at Universidad Politecnica de Puerto Rico. This is an increase from the 2,112 students who took online classes the previous year.
| Year | Took at Least One Online Class | Took All Classes Online |
|---|---|---|
| 2022-2023 | 2,311 | 861 |
| 2021-2022 | 2,112 | 545 |
| 2020-2021 | 1,927 | 444 |
| 2018-2019 | 1,301 | 359 |
Learn more about online learning at Universidad Politecnica de Puerto Rico.
Footnotes
*The racial-ethnic minorities count is calculated by taking the total number of students and subtracting white students, international students, and students whose race/ethnicity was unknown. This number is then divided by the total number of students at the school to obtain the racial-ethnic minorities percentage.
References
More about our data sources and methodologies.