UAB total enrollment is approximately 22,563 students. 10,402 are undergraduates and 4,478 are graduate students.
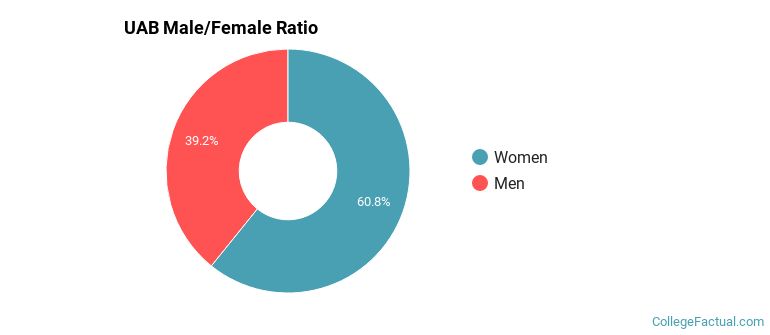
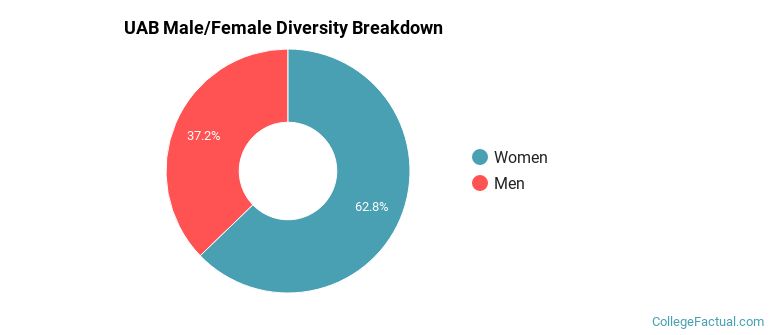
Male/Female Breakdown of Undergraduates
The full-time UAB undergraduate population is made up of 62% women, and 38% men.
For the gender breakdown for all students, go here.
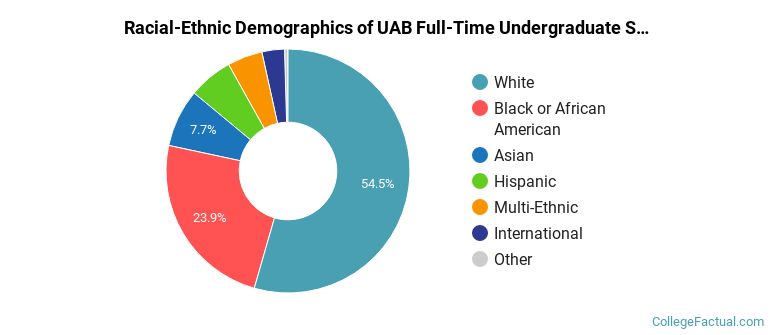
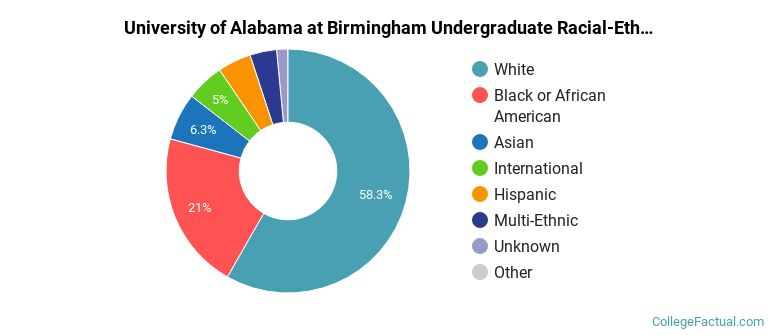
UAB Racial/Ethnic Breakdown of Undergraduates
| Race/Ethnicity | Number |
|---|---|
| White | 5,637 |
| Black or African American | 2,354 |
| Asian | 842 |
| Hispanic | 662 |
| Multi-Ethnic | 512 |
| International | 310 |
| Unknown | 60 |
| Native Hawaiian or Pacific Islander | 4 |
See racial/ethnic breakdown for all students.
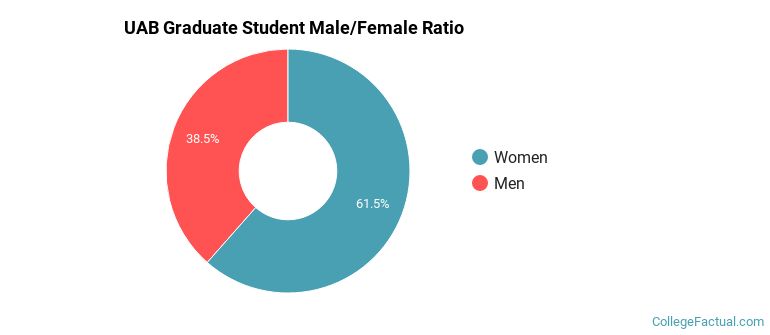
Male/Female Breakdown of Graduate Students
About 62% of full-time grad students are women, and 38% men.
For the gender breakdown for all students, go here.
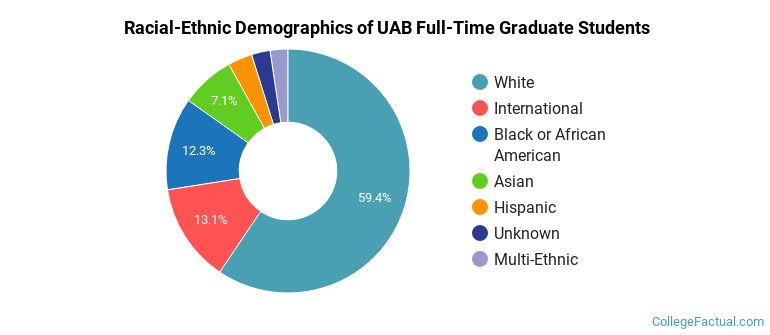
UAB Racial-Ethnic Breakdown of Graduate Students
| Race/Ethnicity | Number |
|---|---|
| White | 2,593 |
| Black or African American | 619 |
| International | 543 |
| Asian | 324 |
| Hispanic | 148 |
| Unknown | 129 |
| Multi-Ethnic | 110 |
| Native Hawaiian or Pacific Islander | 2 |
See racial/ethnic breakdown for all students.
| Race/Ethnicity | Number |
|---|---|
| White | 12,966 |
| Black or African American | 4,746 |
| Asian | 1,466 |
| International | 1,084 |
| Hispanic | 1,050 |
| Multi-Ethnic | 826 |
| Unknown | 358 |
| Native Hawaiian or Pacific Islander | 8 |
There are approximately 14,320 female students and 8,243 male students at UAB.
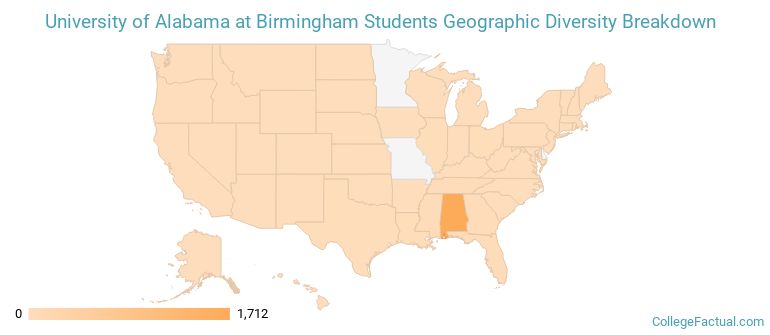
UAB ranks 1,010 out of 2,183 when it comes to geographic diversity.
13.27% of UAB students come from out of state, and 2.33% come from out of the country.
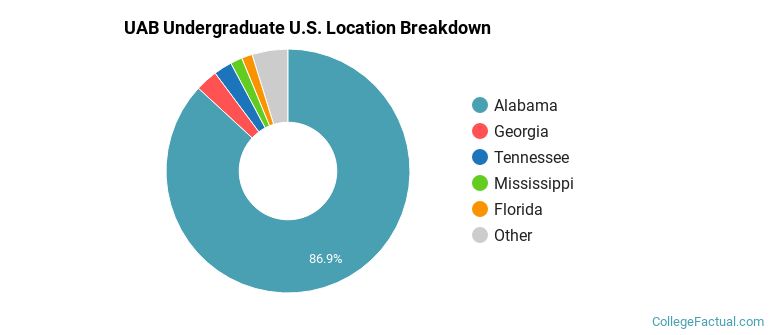
The undergraduate student body is split among 30 states (may include Washington D.C.). Click on the map for more detail.
| State | Amount |
|---|---|
| Alabama | 1,712 |
| Georgia | 58 |
| Tennessee | 48 |
| Mississippi | 31 |
| Florida | 28 |
Students from 86 countries are represented at this school, with the majority of the international students coming from India, China, and Saudi Arabia.
Learn more about international students at UAB.
A traditional college student is defined as being between the ages of 18-21. At UAB, 36.16% of students fall into that category, compared to the national average of 60%.
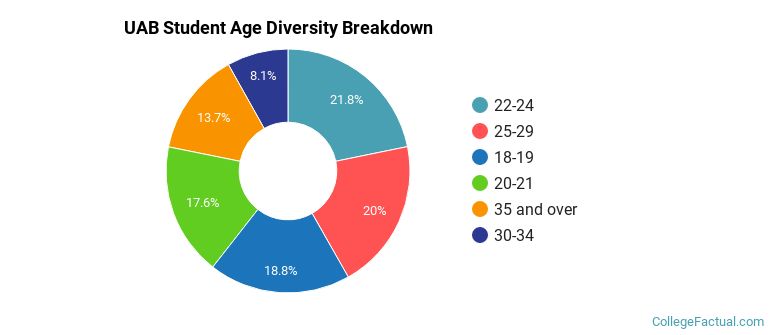
| Student Age Group | Amount |
|---|---|
| 22-24 | 4,525 |
| 25-29 | 4,148 |
| 18-19 | 3,904 |
| 20-21 | 3,654 |
| 35 and over | 2,845 |
| 30-34 | 1,687 |
| Under 18 | 0 |
Footnotes
*The racial-ethnic minorities count is calculated by taking the total number of students and subtracting white students, international students, and students whose race/ethnicity was unknown. This number is then divided by the total number of students at the school to obtain the racial-ethnic minorities percentage.
References
Department of Homeland Security Citizenship and Immigration Services
Find out how College Factual created their Diversity Rankings.