UAF total enrollment is approximately 6,813 students. 2,399 are undergraduates and 384 are graduate students.
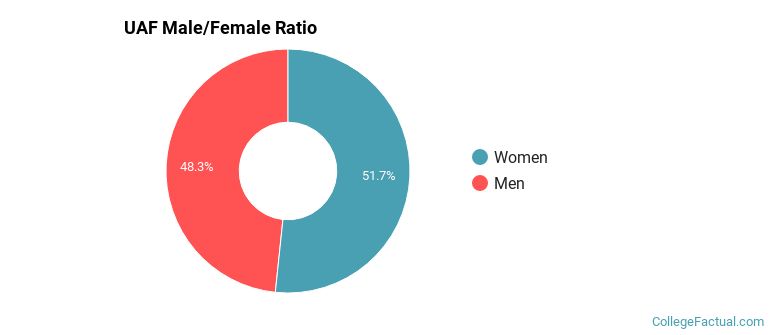
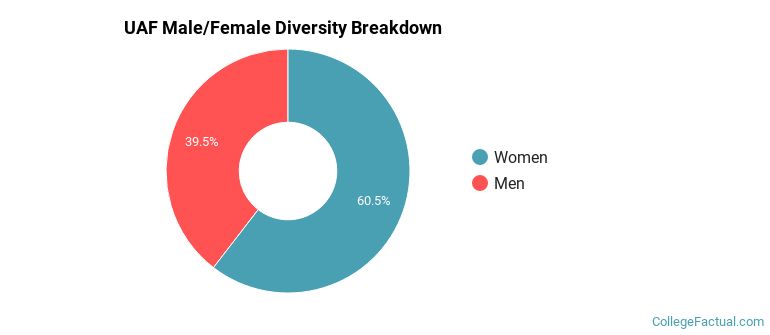
Male/Female Breakdown of Undergraduates
The full-time UAF undergraduate population is made up of 53% women, and 47% men.
For the gender breakdown for all students, go here.
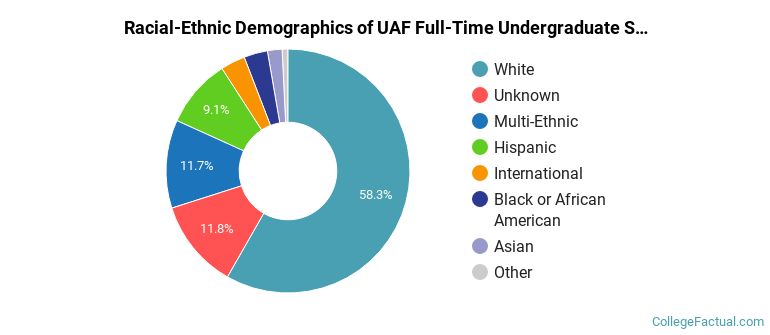
UAF Racial/Ethnic Breakdown of Undergraduates
| Race/Ethnicity | Number |
|---|---|
| White | 1,312 |
| Multi-Ethnic | 273 |
| Hispanic | 190 |
| Unknown | 134 |
| Black or African American | 80 |
| Asian | 53 |
| International | 49 |
| Native Hawaiian or Pacific Islander | 24 |
See racial/ethnic breakdown for all students.
Male/Female Breakdown of Graduate Students
About 54% of full-time grad students are women, and 46% men.

For the gender breakdown for all students, go here.
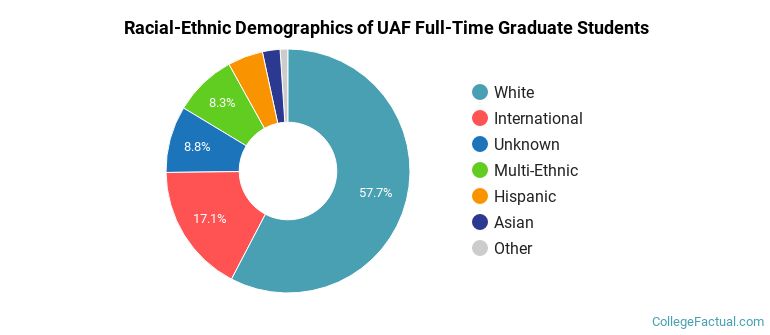
UAF Racial-Ethnic Breakdown of Graduate Students
| Race/Ethnicity | Number |
|---|---|
| White | 207 |
| International | 62 |
| Unknown | 36 |
| Multi-Ethnic | 28 |
| Hispanic | 17 |
| Asian | 9 |
| Black or African American | 4 |
| Native Hawaiian or Pacific Islander | 0 |
See racial/ethnic breakdown for all students.
| Race/Ethnicity | Number |
|---|---|
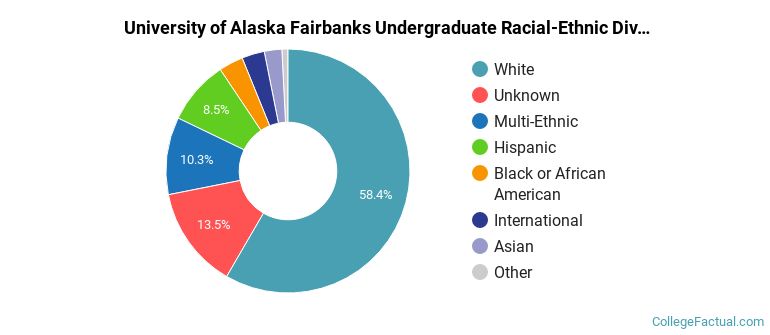
| White | 3,615 |
| Unknown | 648 |
| Multi-Ethnic | 644 |
| Hispanic | 490 |
| Black or African American | 210 |
| Asian | 161 |
| International | 150 |
| Native Hawaiian or Pacific Islander | 48 |
There are approximately 4,108 female students and 2,705 male students at UAF.
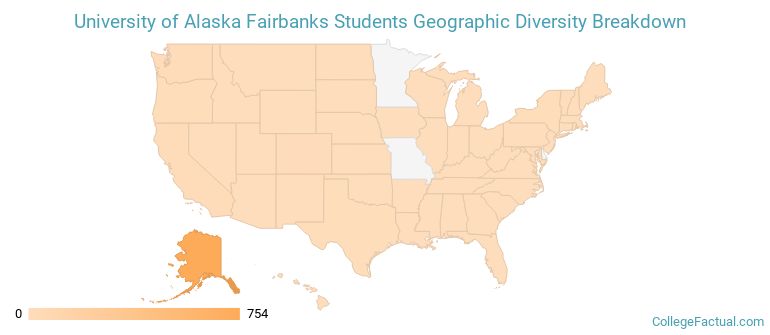
UAF ranks 875 out of 2,183 when it comes to geographic diversity.
9.59% of UAF students come from out of state, and 1.3% come from out of the country.
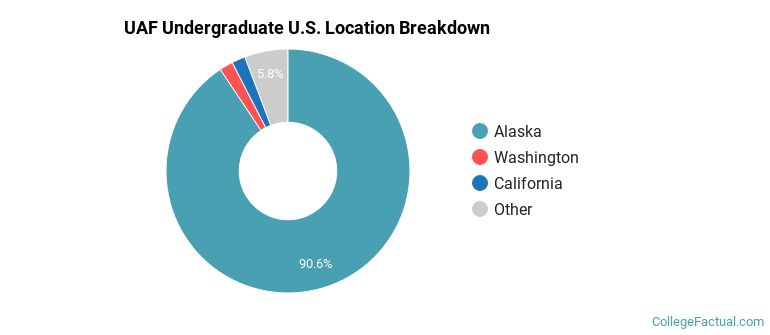
The undergraduate student body is split among 25 states (may include Washington D.C.). Click on the map for more detail.
| State | Amount |
|---|---|
| Alaska | 754 |
| California | 15 |
| Washington | 15 |
| Colorado | 8 |
| New York | 4 |
Students from 47 countries are represented at this school, with the majority of the international students coming from India, Canada, and China.
Learn more about international students at UAF.
A traditional college student is defined as being between the ages of 18-21. At UAF, 29.63% of students fall into that category, compared to the national average of 60%.
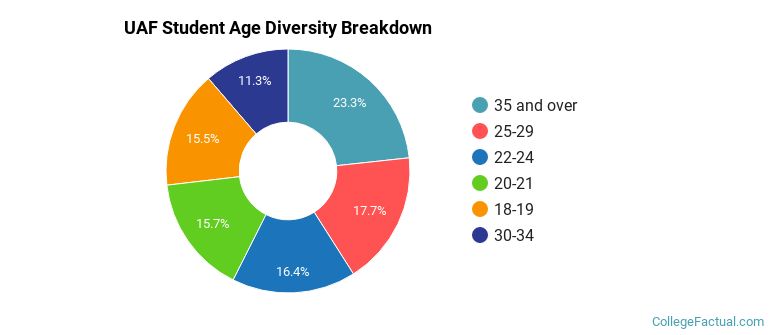
| Student Age Group | Amount |
|---|---|
| 35 and over | 1,690 |
| 25-29 | 1,286 |
| 22-24 | 1,193 |
| 20-21 | 1,142 |
| 18-19 | 1,129 |
| 30-34 | 821 |
| Under 18 | 0 |
Footnotes
*The racial-ethnic minorities count is calculated by taking the total number of students and subtracting white students, international students, and students whose race/ethnicity was unknown. This number is then divided by the total number of students at the school to obtain the racial-ethnic minorities percentage.
References
Department of Homeland Security Citizenship and Immigration Services
Image Credit: By Burntorange72 under License