UAS total enrollment is approximately 2,070 students. 534 are undergraduates and 64 are graduate students.
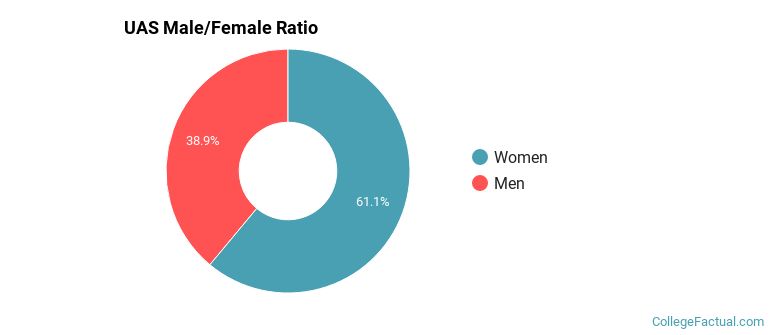
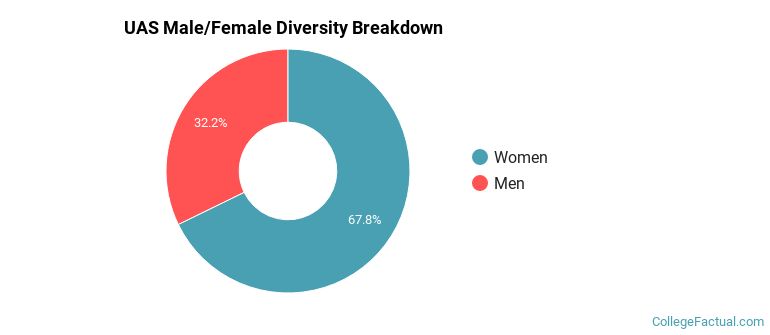
Male/Female Breakdown of Undergraduates
The full-time UAS undergraduate population is made up of 59% women, and 41% men.
For the gender breakdown for all students, go here.
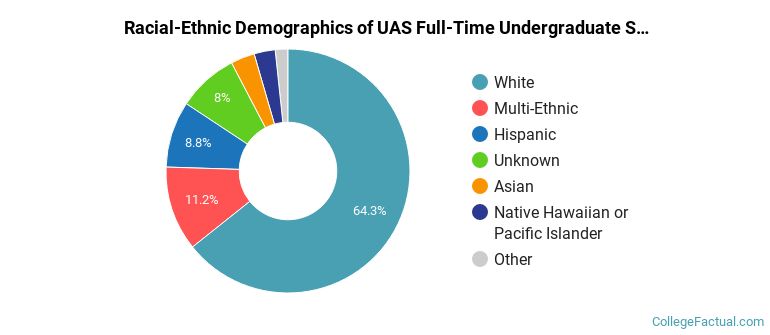
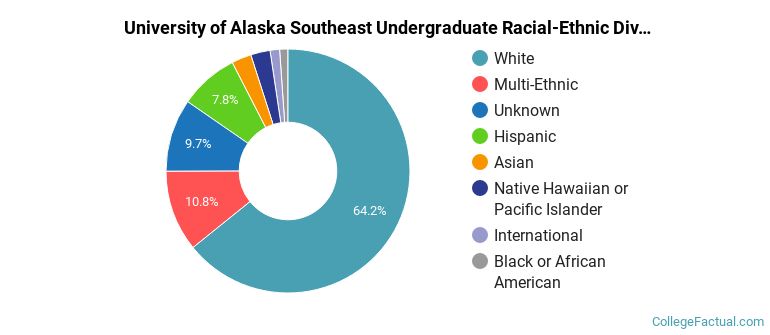
UAS Racial/Ethnic Breakdown of Undergraduates
| Race/Ethnicity | Number |
|---|---|
| White | 300 |
| Multi-Ethnic | 64 |
| Hispanic | 52 |
| Unknown | 22 |
| Native Hawaiian or Pacific Islander | 14 |
| Asian | 13 |
| International | 3 |
| Black or African American | 1 |
See racial/ethnic breakdown for all students.
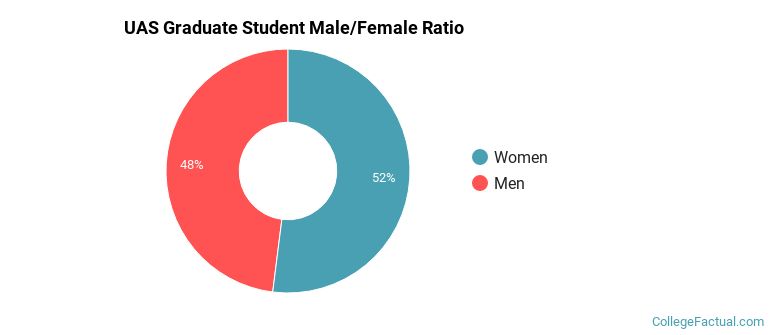
Male/Female Breakdown of Graduate Students
About 56% of full-time grad students are women, and 44% men.
For the gender breakdown for all students, go here.
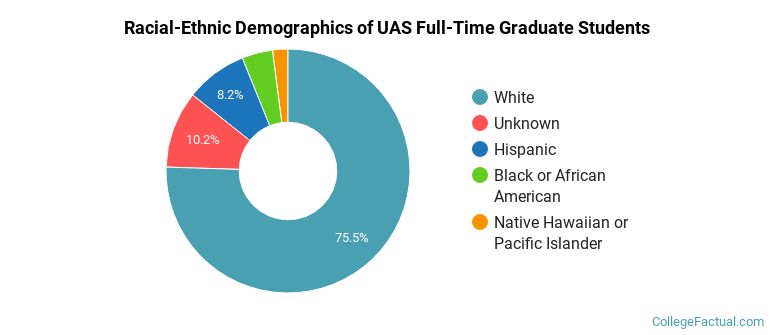
UAS Racial-Ethnic Breakdown of Graduate Students
| Race/Ethnicity | Number |
|---|---|
| White | 39 |
| Hispanic | 6 |
| Multi-Ethnic | 5 |
| Unknown | 4 |
| Asian | 3 |
| International | 2 |
| Black or African American | 1 |
| Native Hawaiian or Pacific Islander | 1 |
See racial/ethnic breakdown for all students.
| Race/Ethnicity | Number |
|---|---|
| White | 1,231 |
| Multi-Ethnic | 204 |
| Hispanic | 145 |
| Unknown | 132 |
| Asian | 58 |
| Native Hawaiian or Pacific Islander | 38 |
| International | 24 |
| Black or African American | 16 |
There are approximately 1,388 female students and 682 male students at UAS.
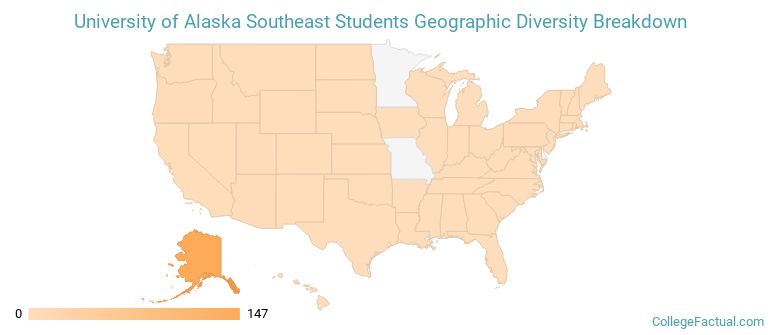
UAS ranks 1,293 out of 2,183 when it comes to geographic diversity.
8.7% of UAS students come from out of state, and 0.62% come from out of the country.
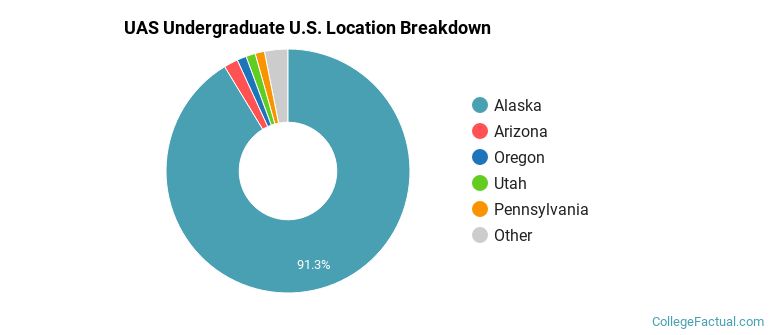
The undergraduate student body is split among 10 states (may include Washington D.C.). Click on the map for more detail.
| State | Amount |
|---|---|
| Alaska | 147 |
| Arizona | 3 |
| Oregon | 2 |
| Pennsylvania | 2 |
| Utah | 2 |
There are international students present from Canada.
Learn more about international students at UAS.
A traditional college student is defined as being between the ages of 18-21. At UAS, 22.84% of students fall into that category, compared to the national average of 60%.
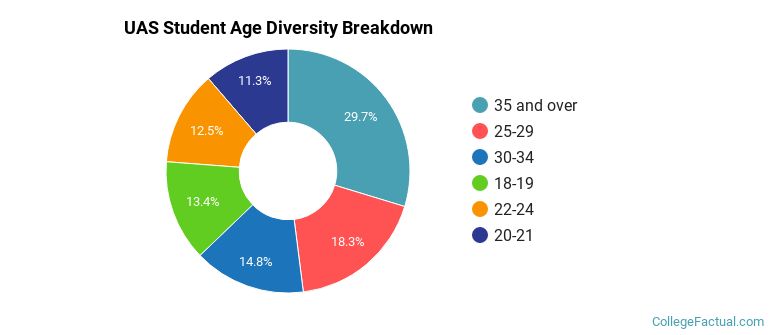
| Student Age Group | Amount |
|---|---|
| 35 and over | 643 |
| 25-29 | 396 |
| 30-34 | 321 |
| 18-19 | 290 |
| 22-24 | 270 |
| 20-21 | 245 |
| Under 18 | 0 |
Footnotes
*The racial-ethnic minorities count is calculated by taking the total number of students and subtracting white students, international students, and students whose race/ethnicity was unknown. This number is then divided by the total number of students at the school to obtain the racial-ethnic minorities percentage.
References