UBridgeport total enrollment is approximately 4,155 students. 1,868 are undergraduates and 797 are graduate students.
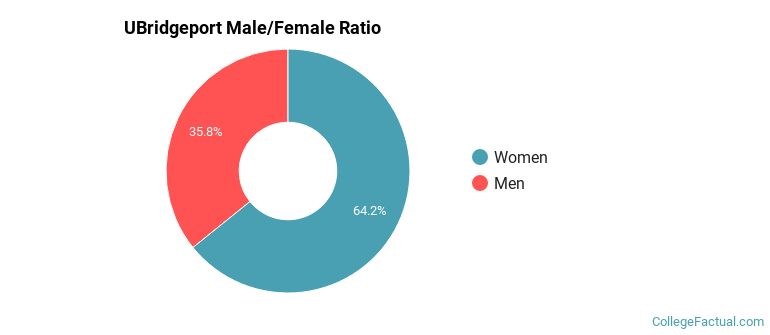
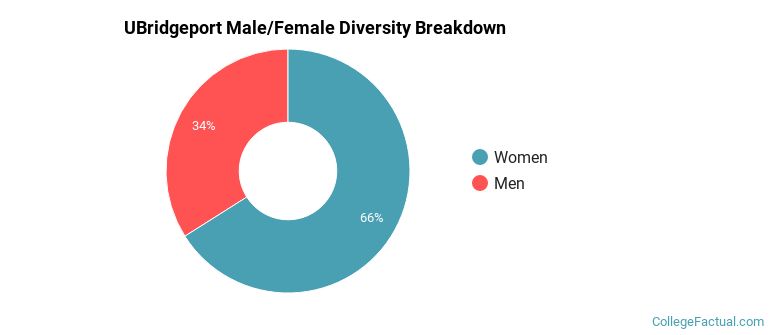
Male/Female Breakdown of Undergraduates
The full-time UBridgeport undergraduate population is made up of 67% women, and 33% men.
For the gender breakdown for all students, go here.
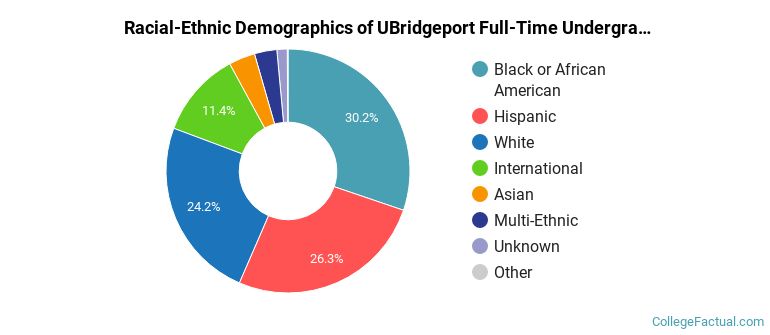
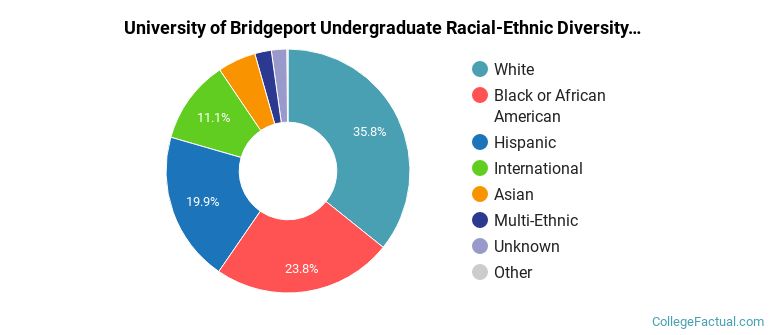
UBridgeport Racial/Ethnic Breakdown of Undergraduates
| Race/Ethnicity | Number |
|---|---|
| Black or African American | 594 |
| Hispanic | 526 |
| White | 457 |
| International | 125 |
| Asian | 82 |
| Unknown | 44 |
| Multi-Ethnic | 29 |
| Native Hawaiian or Pacific Islander | 0 |
See racial/ethnic breakdown for all students.
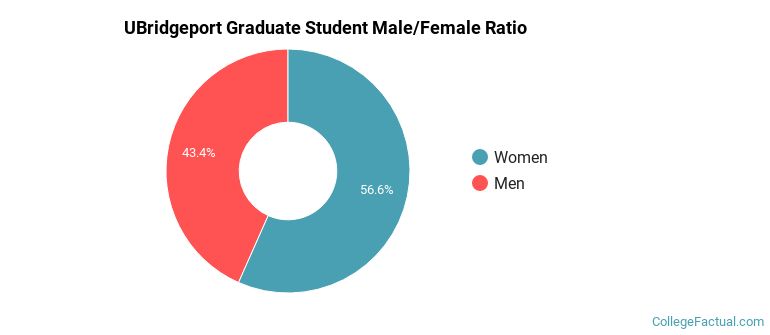
Male/Female Breakdown of Graduate Students
About 59% of full-time grad students are women, and 41% men.
For the gender breakdown for all students, go here.
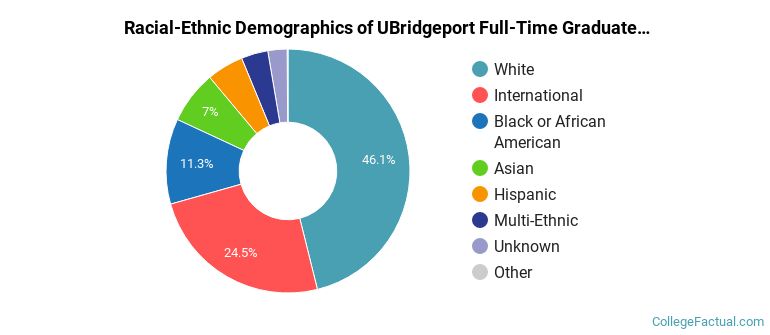
UBridgeport Racial-Ethnic Breakdown of Graduate Students
| Race/Ethnicity | Number |
|---|---|
| White | 374 |
| International | 122 |
| Black or African American | 110 |
| Hispanic | 70 |
| Asian | 63 |
| Multi-Ethnic | 33 |
| Unknown | 16 |
| Native Hawaiian or Pacific Islander | 0 |
See racial/ethnic breakdown for all students.
| Race/Ethnicity | Number |
|---|---|
| White | 1,580 |
| Black or African American | 1,053 |
| Hispanic | 801 |
| International | 323 |
| Asian | 218 |
| Multi-Ethnic | 77 |
| Unknown | 77 |
| Native Hawaiian or Pacific Islander | 0 |
There are approximately 2,864 female students and 1,291 male students at UBridgeport.
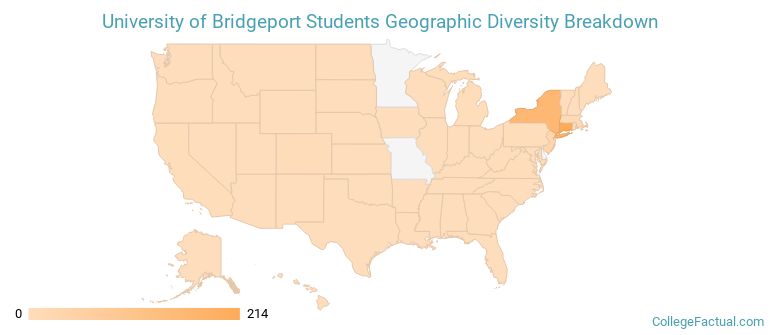
UBridgeport ranks 695 out of 2,183 when it comes to geographic diversity.
51.91% of UBridgeport students come from out of state, and 8.42% come from out of the country.
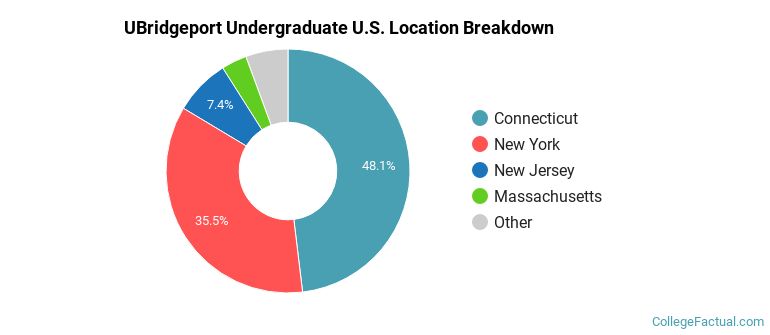
The undergraduate student body is split among 19 states (may include Washington D.C.). Click on the map for more detail.
| State | Amount |
|---|---|
| Connecticut | 214 |
| New York | 158 |
| New Jersey | 33 |
| Massachusetts | 15 |
| Colorado | 4 |
Students from 80 countries are represented at this school, with the majority of the international students coming from India, China, and Saudi Arabia.
Learn more about international students at UBridgeport.
A traditional college student is defined as being between the ages of 18-21. At UBridgeport, 28.10% of students fall into that category, compared to the national average of 60%.
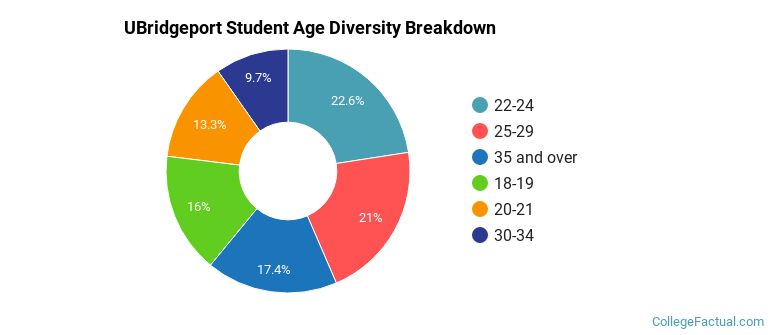
| Student Age Group | Amount |
|---|---|
| 22-24 | 1,175 |
| 25-29 | 1,092 |
| 35 and over | 909 |
| 18-19 | 832 |
| 20-21 | 695 |
| 30-34 | 507 |
| Under 18 | 0 |
Footnotes
*The racial-ethnic minorities count is calculated by taking the total number of students and subtracting white students, international students, and students whose race/ethnicity was unknown. This number is then divided by the total number of students at the school to obtain the racial-ethnic minorities percentage.
References
Department of Homeland Security Citizenship and Immigration Services
Image Credit: By User:Magicpiano under License