Here, you'll find out more about the major, including such details as the number of graduates, what degree levels are offered, ethnicity of students, average salaries, and more. Also, learn how UC Berkeley ranks among other schools offering degrees in bio engineering.
Jump to any of the following sections:
UC Berkeley is in the top 10% of the country for bio engineering. More specifically it was ranked #9 out of 159 schools by College Factual. It is also ranked #1 in California.
During the 2021-2022 academic year, University of California - Berkeley handed out 94 bachelor's degrees in biomedical engineering. This is a decrease of 12% over the previous year when 107 degrees were handed out.
In 2022, 38 students received their master’s degree in bio engineering from UC Berkeley. This makes it the #18 most popular school for bio engineering master’s degree candidates in the country.
In addition, 16 students received their doctoral degrees in bio engineering in 2022, making the school the #20 most popular school in the United States for this category of students.
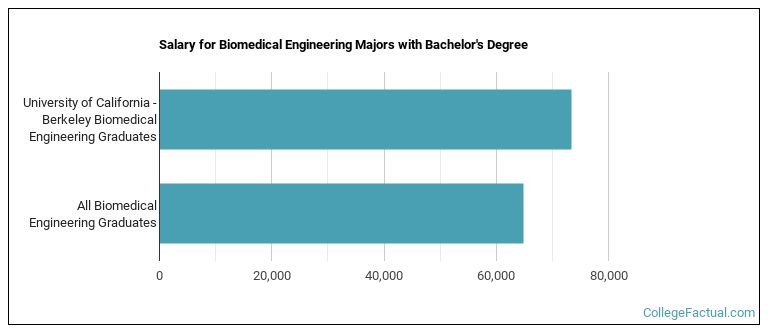
The median salary of bio engineering students who receive their bachelor's degree at UC Berkeley is $73,348. This is great news for graduates of the program, since this figure is higher than the national average of $64,853 for all bio engineering bachelor's degree recipients.
Information about average full-time undergraduate tuition and fees is shown in the table below.
| In State | Out of State | |
|---|---|---|
| Tuition | $11,834 | $42,611 |
| Fees | $3,016 | $3,016 |
| Books and Supplies | $1,273 | $1,273 |
| On Campus Room and Board | $22,692 | $22,692 |
| On Campus Other Expenses | $6,238 | $6,238 |
Learn more about UC Berkeley tuition and fees.
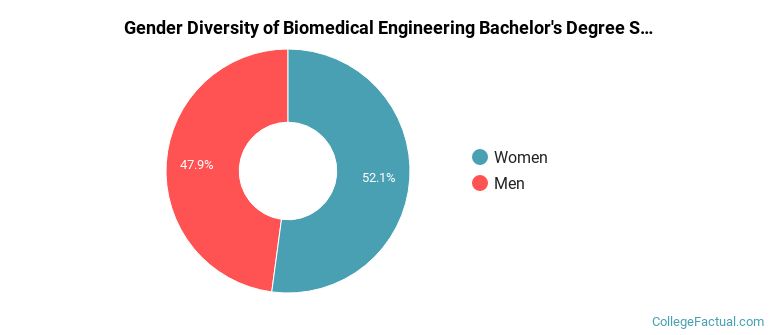
Of the 94 students who earned a bachelor's degree in Biomedical Engineering from UC Berkeley in 2021-2022, 48% were men and 52% were women.
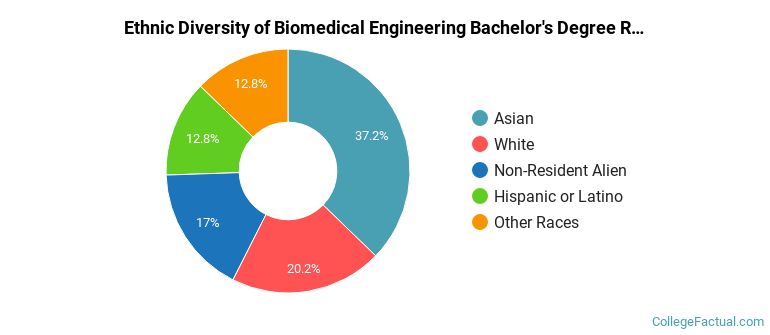
The following table and chart show the ethnic background for students who recently graduated from University of California - Berkeley with a bachelor's in bio engineering.
| Ethnic Background | Number of Students |
|---|---|
| Asian | 35 |
| Black or African American | 0 |
| Hispanic or Latino | 12 |
| White | 19 |
| Non-Resident Aliens | 16 |
| Other Races | 12 |
Online degrees for the UC Berkeley bio engineering bachelor’s degree program are not available at this time. To see if the school offers distance learning options in other areas, visit the UC Berkeley Online Learning page.
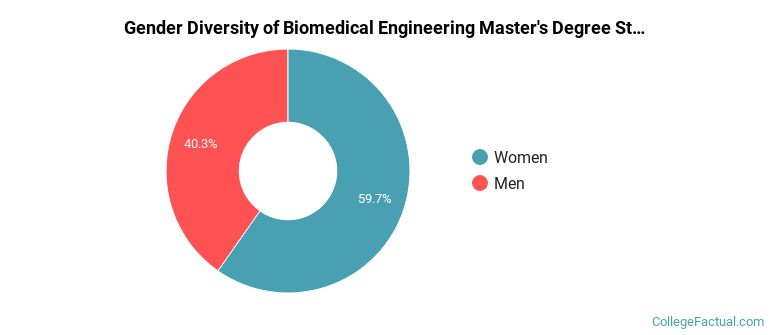
The bio engineering program at UC Berkeley awarded 72 master's degrees in 2021-2022. About 40% of these degrees went to men with the other 60% going to women.
The following table and chart show the ethnic background for students who recently graduated from University of California - Berkeley with a master's in bio engineering.
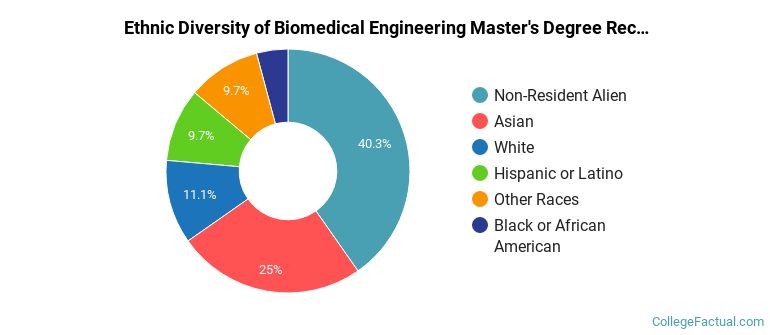
| Ethnic Background | Number of Students |
|---|---|
| Asian | 18 |
| Black or African American | 3 |
| Hispanic or Latino | 7 |
| White | 8 |
| Non-Resident Aliens | 29 |
| Other Races | 7 |
Take a look at the following statistics related to the make-up of the bio engineering majors at University of California - Berkeley.
| Related Major | Annual Graduates |
|---|---|
| Electrical Engineering | 833 |
| Mechanical Engineering | 508 |
| Civil Engineering | 383 |
| Operations Research | 261 |
| Chemical Engineering | 152 |
More about our data sources and methodologies.