Here, you'll find out more about the major, including such details as the number of graduates, what degree levels are offered, ethnicity of students, and more. We've also included details on how UC Davis ranks compared to other colleges offering a major in agricultural production.
Go directly to any of the following sections:
UC Davis is in the top 10% of the country for agricultural production. More specifically it was ranked #3 out of 35 schools by College Factual. It is also ranked #1 in California.
| Ranking Type | Rank |
|---|---|
| Best Agricultural Production Schools | 3 |
| Best Agricultural Production Bachelor’s Degree Schools | 3 |
During the 2021-2022 academic year, University of California - Davis handed out 28 bachelor's degrees in agricultural production. This is a decrease of 15% over the previous year when 33 degrees were handed out.
In 2022, 10 students received their master’s degree in agricultural production from UC Davis. This makes it the #3 most popular school for agricultural production master’s degree candidates in the country.
The average full-time tuition and fees for undergraduates are shown in the table below.
| In State | Out of State | |
|---|---|---|
| Tuition | $11,834 | $42,611 |
| Fees | $3,413 | $3,413 |
| Books and Supplies | $1,381 | $1,381 |
| On Campus Room and Board | $19,068 | $19,068 |
| On Campus Other Expenses | $5,359 | $5,359 |
Learn more about UC Davis tuition and fees.
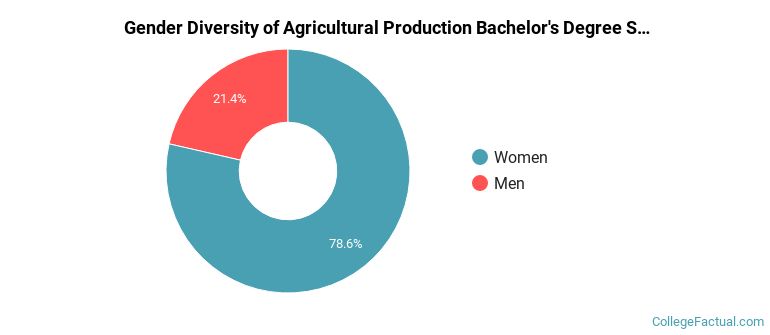
For the most recent academic year available, 21% of agricultural production bachelor's degrees went to men and 79% went to women.
The following table and chart show the ethnic background for students who recently graduated from University of California - Davis with a bachelor's in agricultural production.
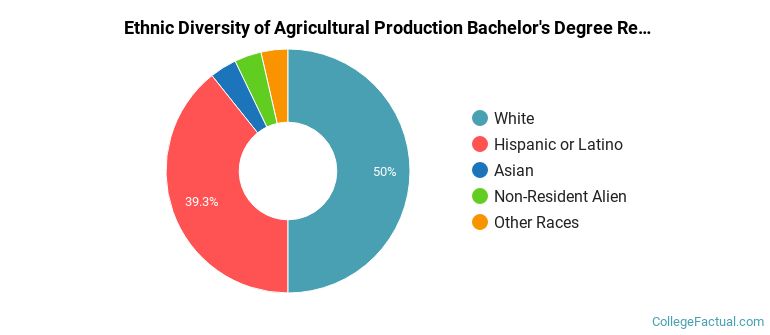
| Ethnic Background | Number of Students |
|---|---|
| Asian | 1 |
| Black or African American | 0 |
| Hispanic or Latino | 11 |
| White | 14 |
| Non-Resident Aliens | 1 |
| Other Races | 1 |
UC Davis does not offer an online option for its agricultural production bachelor’s degree program at this time. To see if the school offers distance learning options in other areas, visit the UC Davis Online Learning page.
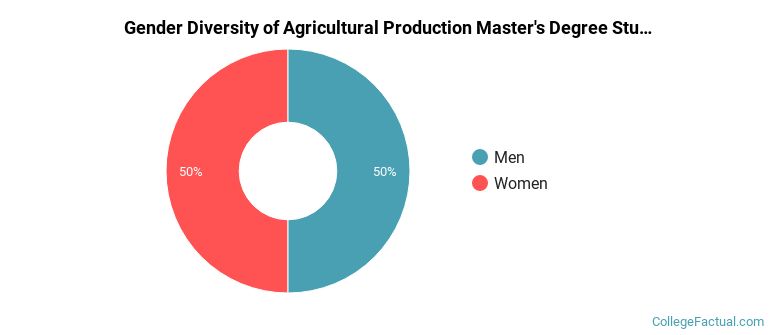
The agricultural production program at UC Davis awarded 8 master's degrees in 2021-2022. About 50% of these degrees went to men with the other 50% going to women.
The following table and chart show the ethnic background for students who recently graduated from University of California - Davis with a master's in agricultural production.
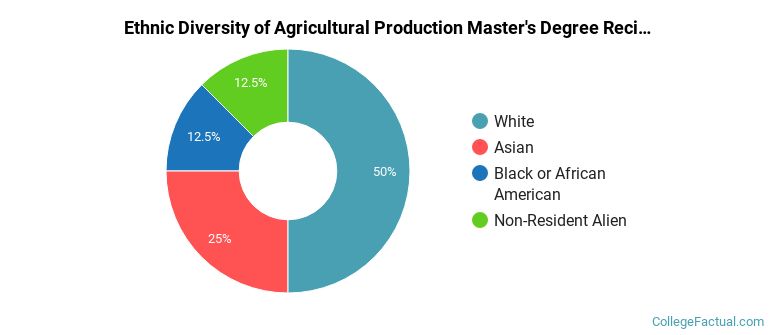
| Ethnic Background | Number of Students |
|---|---|
| Asian | 2 |
| Black or African American | 1 |
| Hispanic or Latino | 0 |
| White | 4 |
| Non-Resident Aliens | 1 |
| Other Races | 0 |
Take a look at the following statistics related to the make-up of the agricultural production majors at University of California - Davis.
| Related Major | Annual Graduates |
|---|---|
| Animal Science | 370 |
| Veterinary Medicine | 154 |
| Food Science Technology | 90 |
| Plant Sciences | 46 |
| Other Agriculture | 14 |
More about our data sources and methodologies.