UCLA total enrollment is approximately 44,589 students. 31,068 are undergraduates and 11,871 are graduate students.
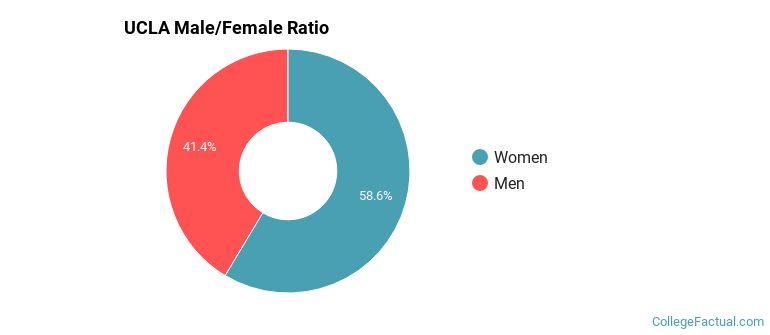
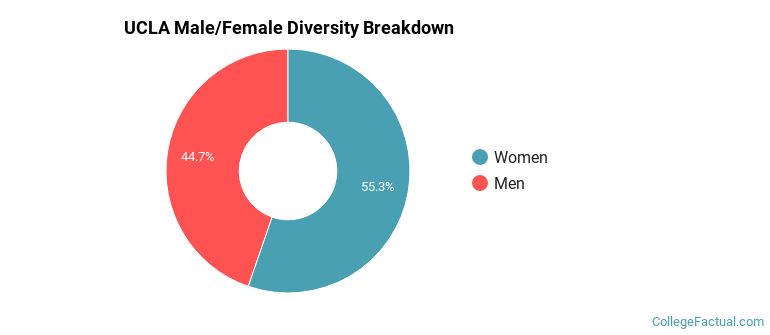
Male/Female Breakdown of Undergraduates
The full-time UCLA undergraduate population is made up of 59% women, and 41% men.
For the gender breakdown for all students, go here.
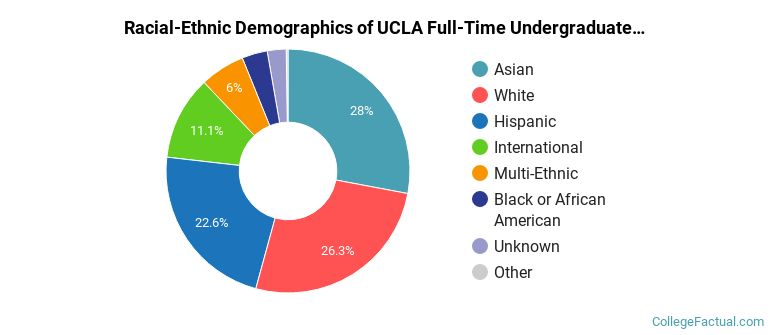
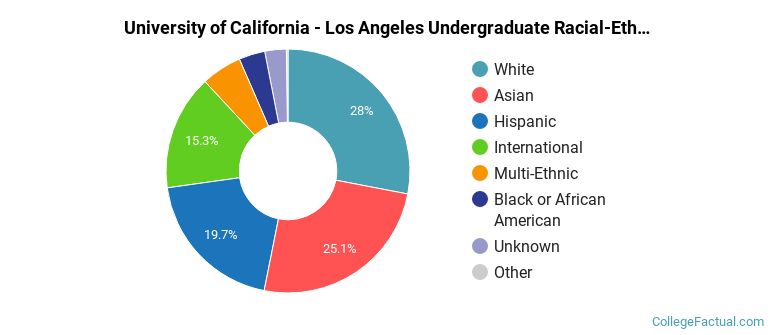
UCLA Racial/Ethnic Breakdown of Undergraduates
| Race/Ethnicity | Number |
|---|---|
| Asian | 9,010 |
| White | 8,009 |
| Hispanic | 6,813 |
| International | 3,206 |
| Multi-Ethnic | 1,945 |
| Unknown | 992 |
| Black or African American | 988 |
| Native Hawaiian or Pacific Islander | 61 |
See racial/ethnic breakdown for all students.
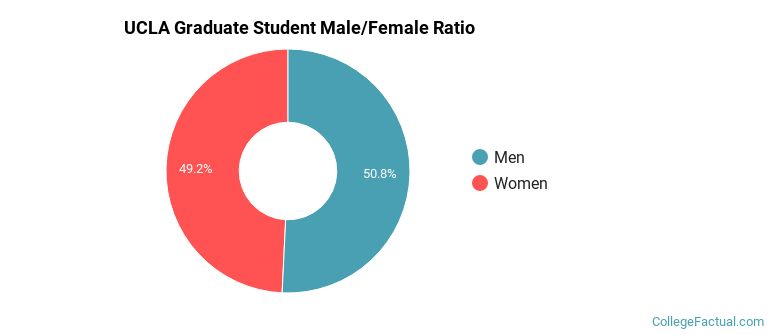
Male/Female Breakdown of Graduate Students
About 50% of full-time grad students are women, and 50% men.
For the gender breakdown for all students, go here.
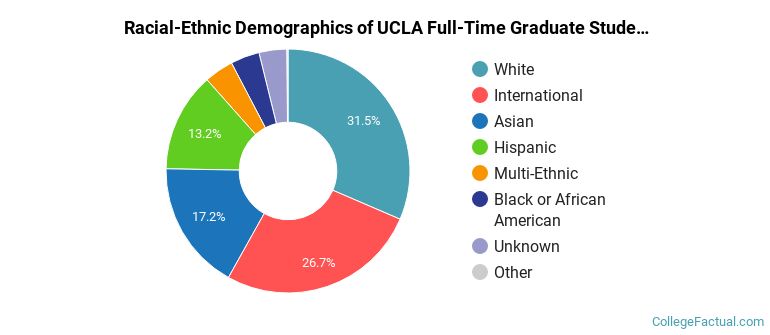
UCLA Racial-Ethnic Breakdown of Graduate Students
| Race/Ethnicity | Number |
|---|---|
| White | 3,787 |
| International | 2,774 |
| Asian | 2,190 |
| Hispanic | 1,696 |
| Black or African American | 507 |
| Multi-Ethnic | 504 |
| Unknown | 372 |
| Native Hawaiian or Pacific Islander | 13 |
See racial/ethnic breakdown for all students.
| Race/Ethnicity | Number |
|---|---|
| White | 12,395 |
| Asian | 11,671 |
| Hispanic | 8,711 |
| International | 6,167 |
| Multi-Ethnic | 2,542 |
| Black or African American | 1,528 |
| Unknown | 1,424 |
| Native Hawaiian or Pacific Islander | 75 |
There are approximately 24,824 female students and 19,765 male students at UCLA.
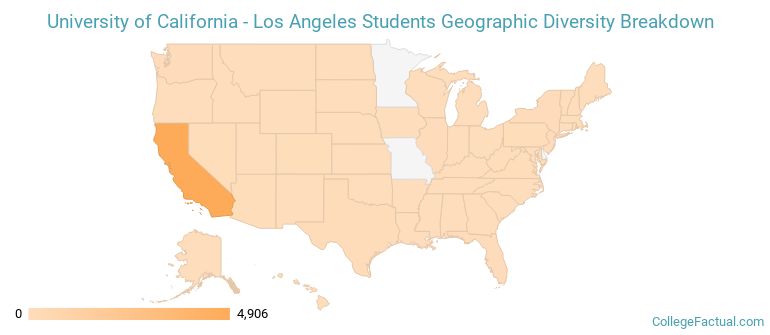
UCLA ranks 443 out of 2,183 when it comes to geographic diversity.
14.4% of UCLA students come from out of state, and 12.33% come from out of the country.
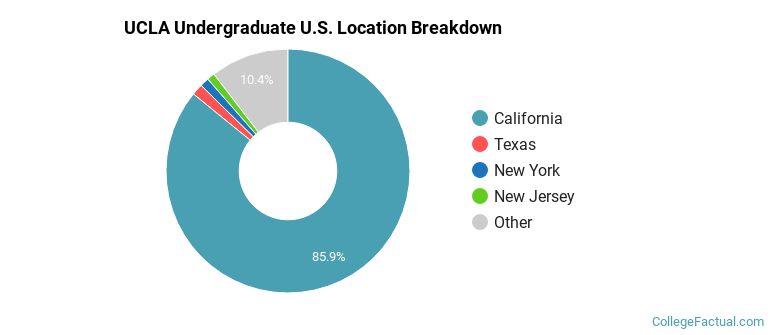
The undergraduate student body is split among 44 states (may include Washington D.C.). Click on the map for more detail.
| State | Amount |
|---|---|
| California | 4,906 |
| Texas | 86 |
| New York | 68 |
| New Jersey | 59 |
| Washington | 54 |
Students from 128 countries are represented at this school, with the majority of the international students coming from China, South Korea, and India.
Learn more about international students at UCLA.
A traditional college student is defined as being between the ages of 18-21. At UCLA, 57.31% of students fall into that category, compared to the national average of 60%.
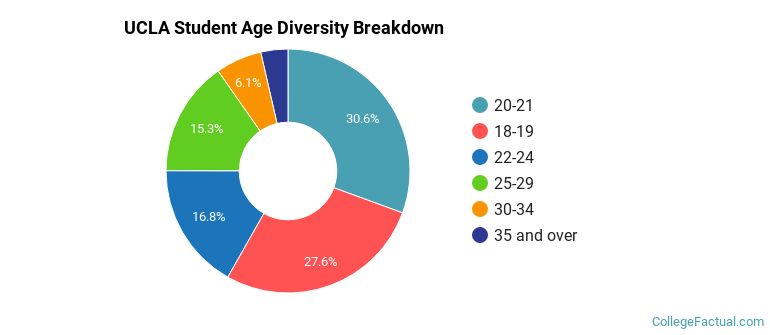
| Student Age Group | Amount |
|---|---|
| 20-21 | 13,254 |
| 18-19 | 11,978 |
| 22-24 | 7,291 |
| 25-29 | 6,617 |
| 30-34 | 2,649 |
| 35 and over | 1,561 |
| Under 18 | 0 |
Footnotes
*The racial-ethnic minorities count is calculated by taking the total number of students and subtracting white students, international students, and students whose race/ethnicity was unknown. This number is then divided by the total number of students at the school to obtain the racial-ethnic minorities percentage.
References
Department of Homeland Security Citizenship and Immigration Services
Image Credit: By Nikhil Kulkarni under License