UC Merced total enrollment is approximately 9,018 students. 8,194 are undergraduates and 737 are graduate students.
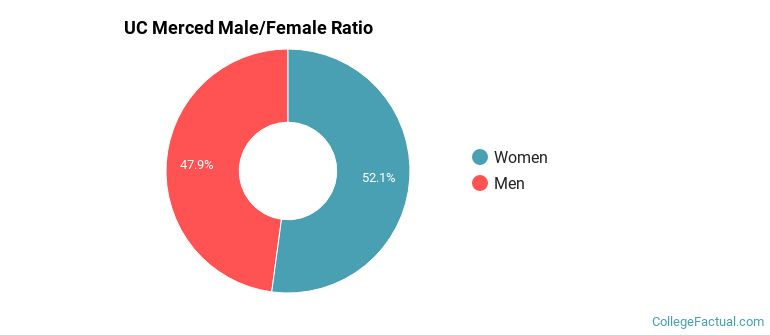
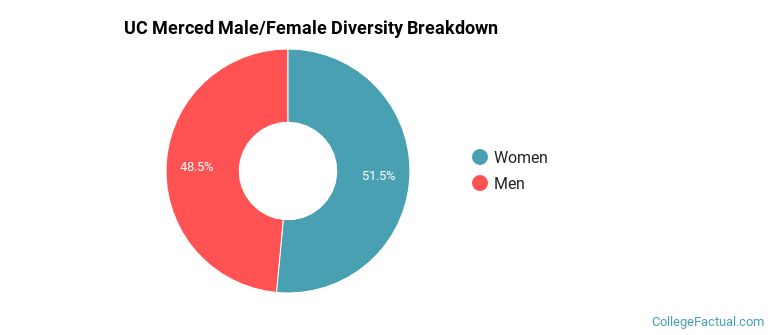
Male/Female Breakdown of Undergraduates
The full-time UC Merced undergraduate population is made up of 53% women, and 47% men.
For the gender breakdown for all students, go here.
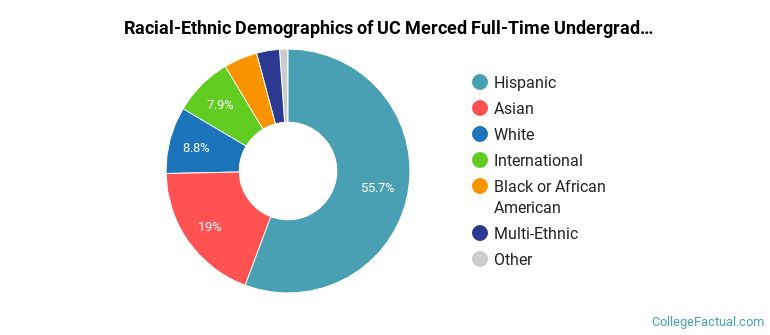
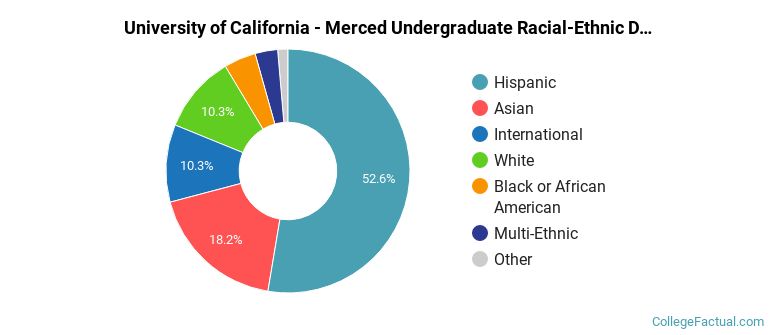
UC Merced Racial/Ethnic Breakdown of Undergraduates
| Race/Ethnicity | Number |
|---|---|
| Hispanic | 4,752 |
| Asian | 1,445 |
| White | 654 |
| International | 619 |
| Black or African American | 368 |
| Multi-Ethnic | 264 |
| Native Hawaiian or Pacific Islander | 41 |
| Unknown | 41 |
See racial/ethnic breakdown for all students.
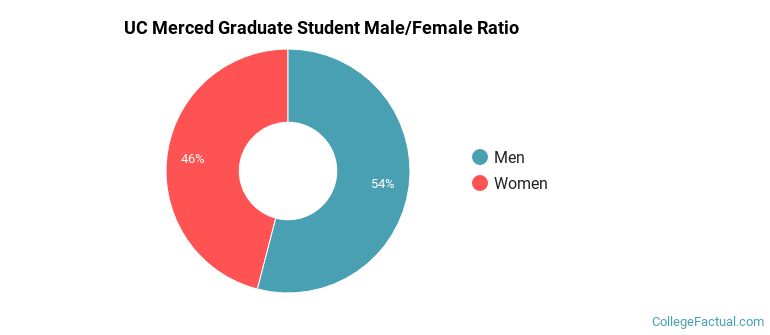
Male/Female Breakdown of Graduate Students
About 46% of full-time grad students are women, and 54% men.
For the gender breakdown for all students, go here.
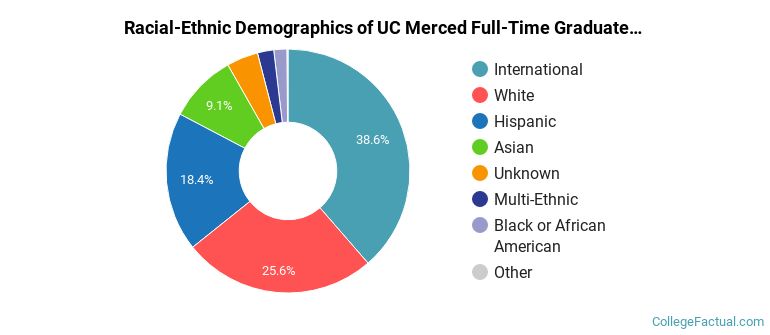
UC Merced Racial-Ethnic Breakdown of Graduate Students
| Race/Ethnicity | Number |
|---|---|
| International | 265 |
| White | 194 |
| Hispanic | 148 |
| Asian | 67 |
| Unknown | 27 |
| Multi-Ethnic | 20 |
| Black or African American | 15 |
| Native Hawaiian or Pacific Islander | 1 |
See racial/ethnic breakdown for all students.
| Race/Ethnicity | Number |
|---|---|
| Hispanic | 4,932 |
| Asian | 1,536 |
| International | 890 |
| White | 864 |
| Black or African American | 387 |
| Multi-Ethnic | 289 |
| Unknown | 68 |
| Native Hawaiian or Pacific Islander | 42 |
There are approximately 4,706 female students and 4,312 male students at UC Merced.
UC Merced ranks 1,961 out of 2,183 when it comes to geographic diversity.
0.1% of UC Merced students come from out of state, and 0.1% come from out of the country.
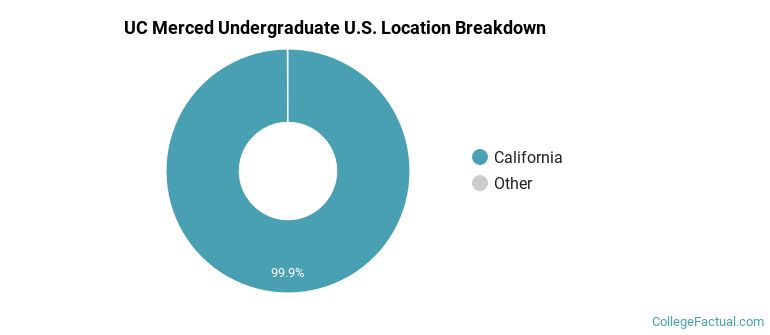
The undergraduate student body is split among 3 states (may include Washington D.C.). Click on the map for more detail.

| State | Amount |
|---|---|
| California | 2,044 |
| Texas | 1 |
| Wisconsin | 1 |
| Alaska | 0 |
| Alabama | 0 |
Students from 39 countries are represented at this school, with the majority of the international students coming from China, India, and Iran.
Learn more about international students at UC Merced.
A traditional college student is defined as being between the ages of 18-21. At UC Merced, 78.36% of students fall into that category, compared to the national average of 60%.
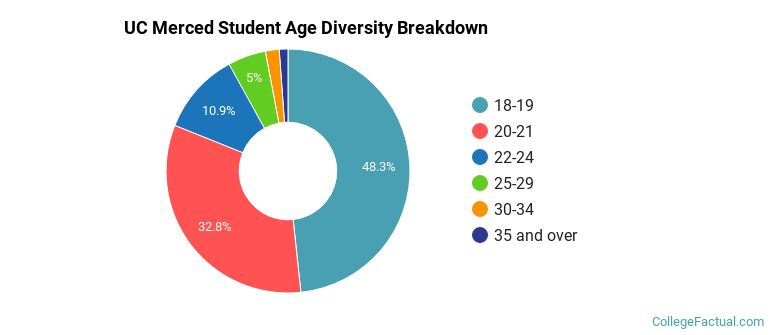
| Student Age Group | Amount |
|---|---|
| 18-19 | 3,720 |
| 20-21 | 2,523 |
| 22-24 | 838 |
| 25-29 | 388 |
| 30-34 | 141 |
| 35 and over | 89 |
| Under 18 | 0 |
Footnotes
*The racial-ethnic minorities count is calculated by taking the total number of students and subtracting white students, international students, and students whose race/ethnicity was unknown. This number is then divided by the total number of students at the school to obtain the racial-ethnic minorities percentage.
References