UCR total enrollment is approximately 26,434 students. 22,056 are undergraduates and 3,410 are graduate students.
Male/Female Breakdown of Undergraduates
The full-time UCR undergraduate population is made up of 54% women, and 46% men.

For the gender breakdown for all students, go here.
UCR Racial/Ethnic Breakdown of Undergraduates
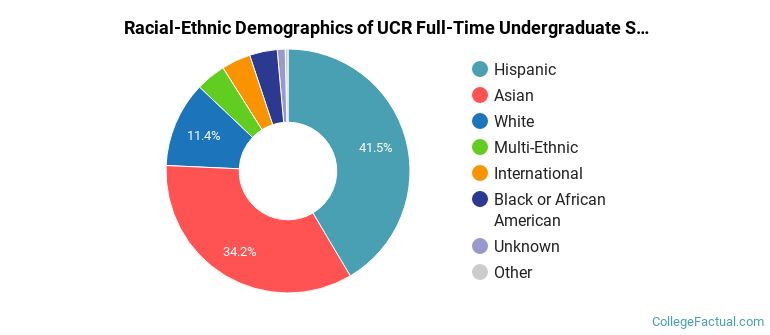
| Race/Ethnicity | Number |
|---|---|
| Hispanic | 9,144 |
| Asian | 7,664 |
| White | 2,453 |
| Multi-Ethnic | 920 |
| International | 787 |
| Black or African American | 776 |
| Unknown | 211 |
| Native Hawaiian or Pacific Islander | 76 |
See racial/ethnic breakdown for all students.
Male/Female Breakdown of Graduate Students
About 47% of full-time grad students are women, and 53% men.

For the gender breakdown for all students, go here.
UCR Racial-Ethnic Breakdown of Graduate Students
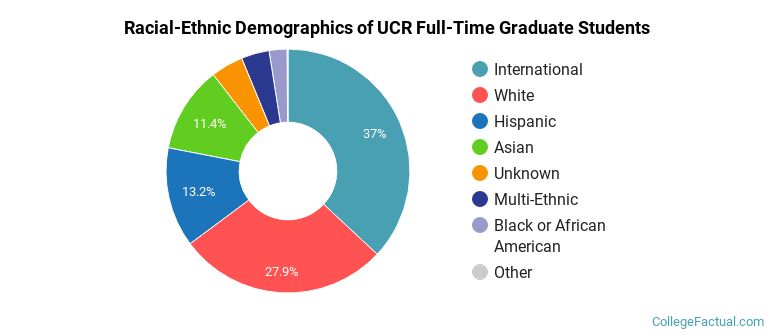
| Race/Ethnicity | Number |
|---|---|
| International | 1,189 |
| White | 893 |
| Hispanic | 574 |
| Asian | 401 |
| Unknown | 129 |
| Multi-Ethnic | 116 |
| Black or African American | 81 |
| Native Hawaiian or Pacific Islander | 4 |
See racial/ethnic breakdown for all students.
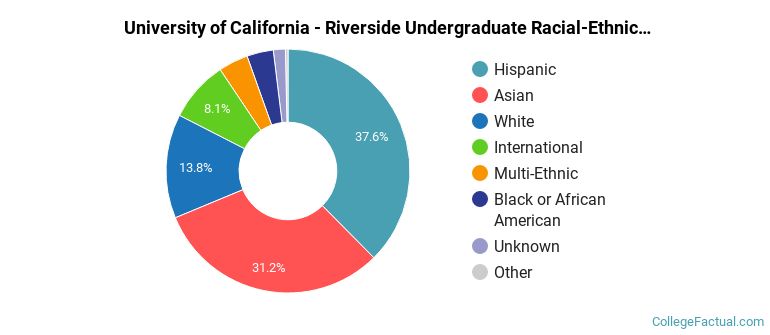
| Race/Ethnicity | Number |
|---|---|
| Hispanic | 10,038 |
| Asian | 8,318 |
| White | 3,537 |
| International | 2,039 |
| Multi-Ethnic | 1,076 |
| Black or African American | 896 |
| Unknown | 393 |
| Native Hawaiian or Pacific Islander | 84 |
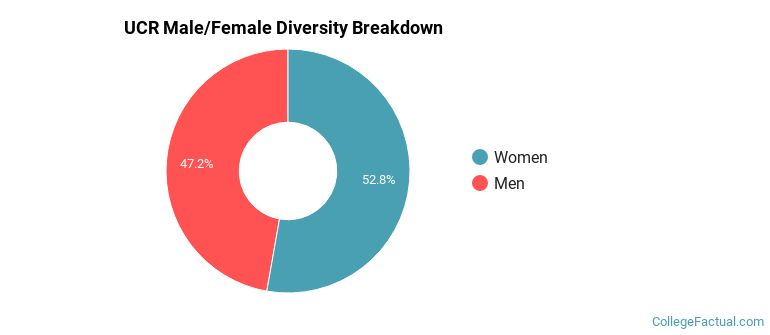
There are approximately 13,941 female students and 12,493 male students at UCR.
UCR ranks 1,571 out of 2,183 when it comes to geographic diversity.
0.74% of UCR students come from out of state, and 1.47% come from out of the country.

The undergraduate student body is split among 24 states (may include Washington D.C.). Click on the map for more detail.

| State | Amount |
|---|---|
| California | 5,239 |
| Florida | 4 |
| Hawaii | 3 |
| Texas | 3 |
| Washington | 3 |
Students from 79 countries are represented at this school, with the majority of the international students coming from China, India, and Taiwan.
Learn more about international students at UCR.
A traditional college student is defined as being between the ages of 18-21. At UCR, 69.92% of students fall into that category, compared to the national average of 60%.

| Student Age Group | Amount |
|---|---|
| 18-19 | 8,990 |
| 20-21 | 7,287 |
| 22-24 | 3,328 |
| 25-29 | 2,081 |
| 30-34 | 622 |
| 35 and over | 459 |
| Under 18 | 0 |
Footnotes
*The racial-ethnic minorities count is calculated by taking the total number of students and subtracting white students, international students, and students whose race/ethnicity was unknown. This number is then divided by the total number of students at the school to obtain the racial-ethnic minorities percentage.
References
Department of Homeland Security Citizenship and Immigration Services
Learn more about how College Factual creates their Diversity Rankings.