UCSD total enrollment is approximately 39,576 students. 30,939 are undergraduates and 7,133 are graduate students.
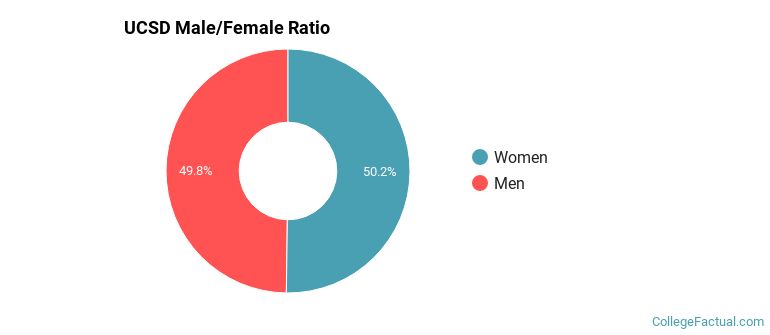
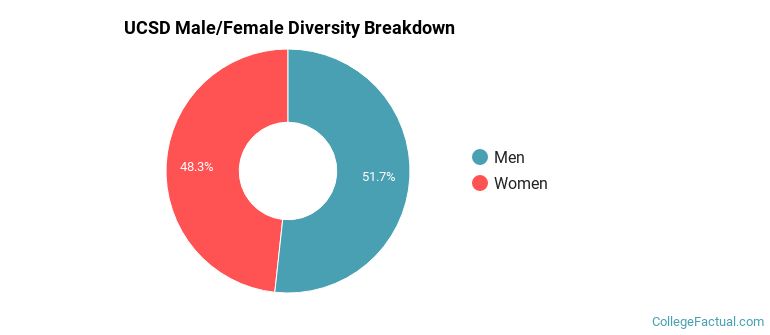
Male/Female Breakdown of Undergraduates
The full-time UCSD undergraduate population is made up of 50% women, and 50% men.
For the gender breakdown for all students, go here.
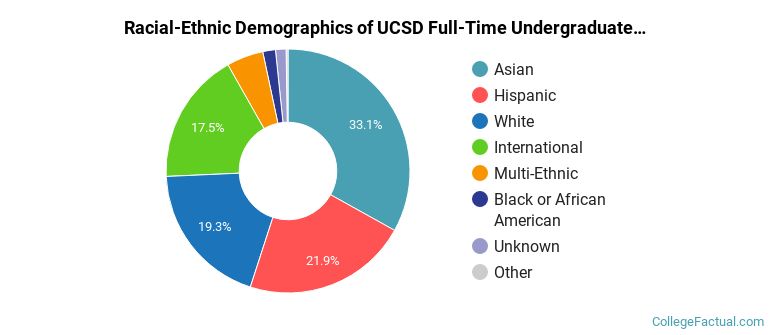
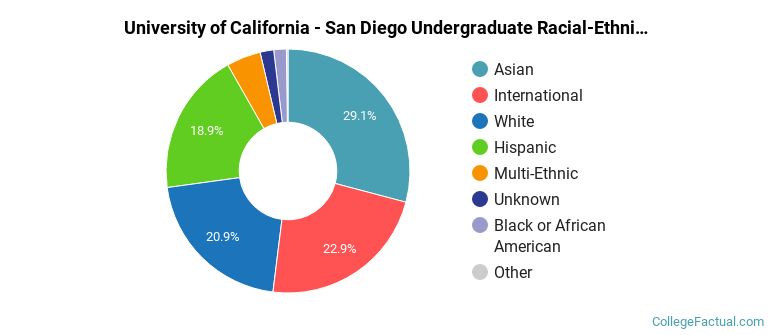
UCSD Racial/Ethnic Breakdown of Undergraduates
| Race/Ethnicity | Number |
|---|---|
| Asian | 10,358 |
| Hispanic | 6,762 |
| White | 5,845 |
| International | 5,247 |
| Multi-Ethnic | 1,623 |
| Black or African American | 530 |
| Unknown | 486 |
| Native Hawaiian or Pacific Islander | 60 |
See racial/ethnic breakdown for all students.
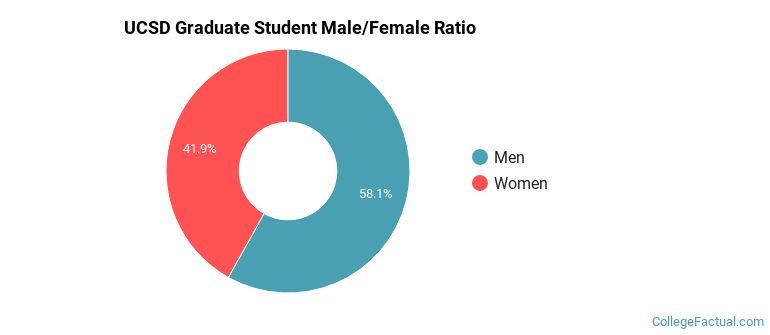
Male/Female Breakdown of Graduate Students
About 43% of full-time grad students are women, and 57% men.
For the gender breakdown for all students, go here.
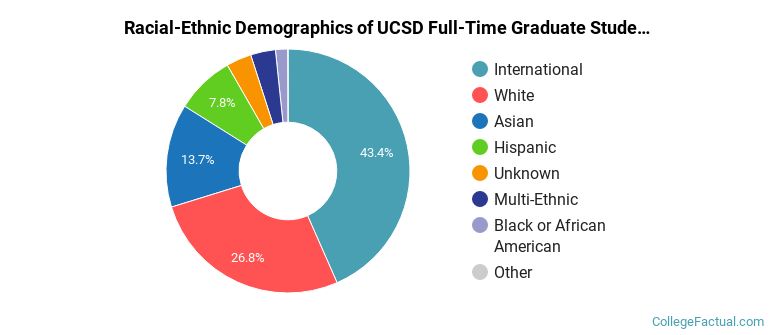
UCSD Racial-Ethnic Breakdown of Graduate Students
| Race/Ethnicity | Number |
|---|---|
| International | 2,803 |
| White | 1,969 |
| Asian | 1,111 |
| Hispanic | 630 |
| Unknown | 253 |
| Multi-Ethnic | 218 |
| Black or African American | 129 |
| Native Hawaiian or Pacific Islander | 4 |
See racial/ethnic breakdown for all students.
| Race/Ethnicity | Number |
|---|---|
| Asian | 11,841 |
| International | 8,451 |
| White | 8,173 |
| Hispanic | 7,616 |
| Multi-Ethnic | 1,898 |
| Unknown | 785 |
| Black or African American | 698 |
| Native Hawaiian or Pacific Islander | 65 |
There are approximately 19,253 female students and 20,323 male students at UCSD.
UCSD ranks 579 out of 2,183 when it comes to geographic diversity.
8.27% of UCSD students come from out of state, and 19.76% come from out of the country.
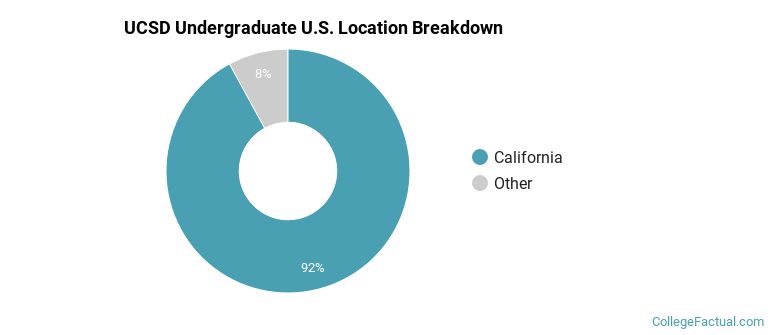
The undergraduate student body is split among 39 states (may include Washington D.C.). Click on the map for more detail.
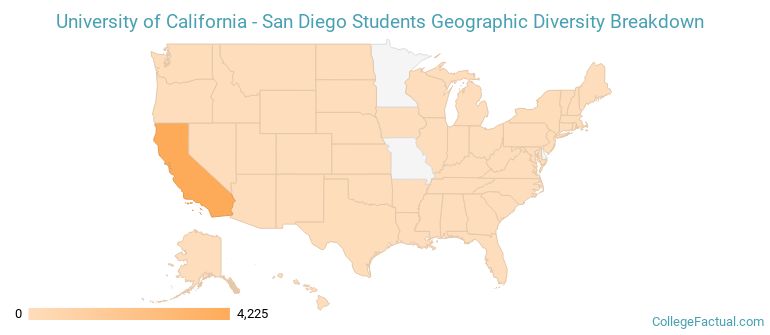
| State | Amount |
|---|---|
| California | 4,225 |
| New Jersey | 37 |
| New York | 29 |
| Texas | 27 |
| Massachusetts | 25 |
Students from 101 countries are represented at this school, with the majority of the international students coming from China, India, and South Korea.
Learn more about international students at UCSD.
A traditional college student is defined as being between the ages of 18-21. At UCSD, 61.37% of students fall into that category, compared to the national average of 60%.
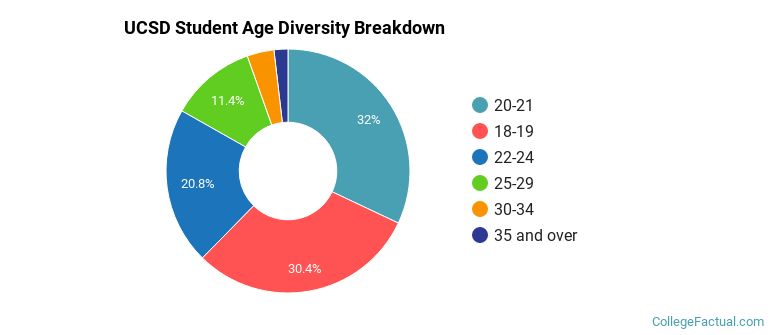
| Student Age Group | Amount |
|---|---|
| 20-21 | 11,268 |
| 18-19 | 10,685 |
| 22-24 | 7,328 |
| 25-29 | 4,004 |
| 30-34 | 1,260 |
| 35 and over | 650 |
| Under 18 | 0 |
Footnotes
*The racial-ethnic minorities count is calculated by taking the total number of students and subtracting white students, international students, and students whose race/ethnicity was unknown. This number is then divided by the total number of students at the school to obtain the racial-ethnic minorities percentage.
References
Department of Homeland Security Citizenship and Immigration Services
Image Credit: By Znode at English Wikipedia under License