UCA total enrollment is approximately 10,335 students. 7,301 are undergraduates and 726 are graduate students.
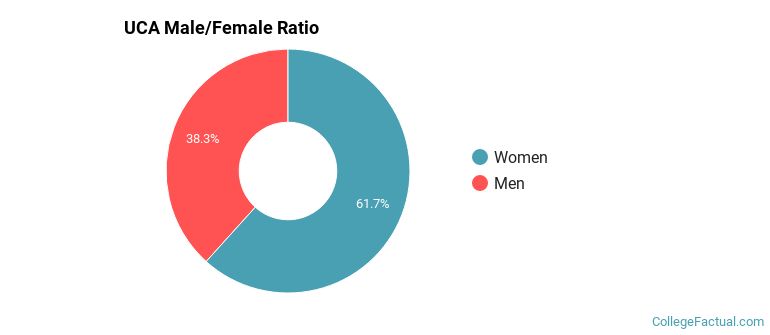
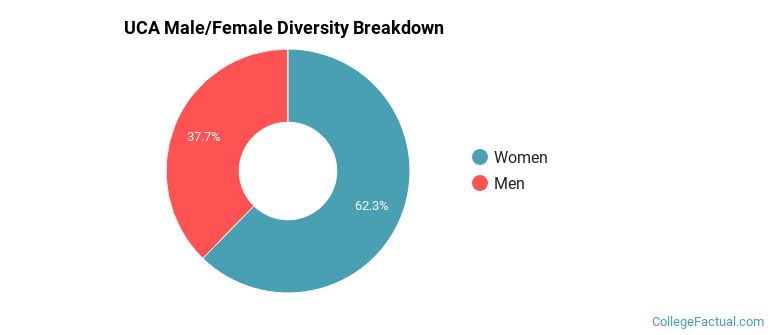
Male/Female Breakdown of Undergraduates
The full-time UCA undergraduate population is made up of 62% women, and 38% men.
For the gender breakdown for all students, go here.
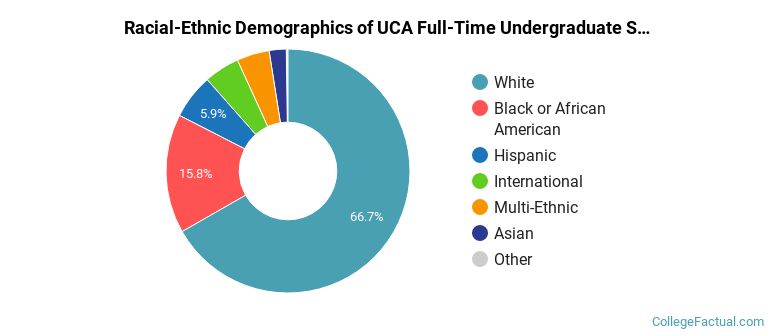
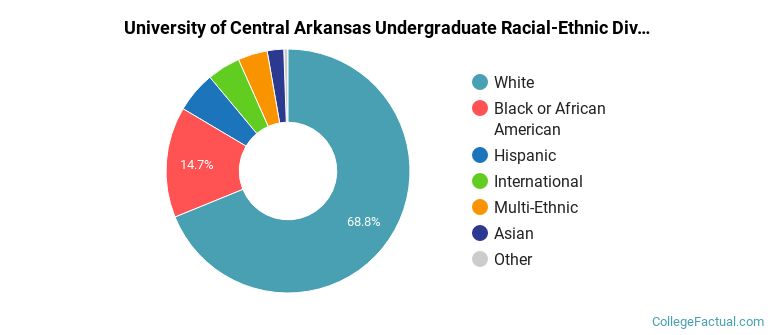
UCA Racial/Ethnic Breakdown of Undergraduates
| Race/Ethnicity | Number |
|---|---|
| White | 4,911 |
| Black or African American | 1,143 |
| Hispanic | 455 |
| Multi-Ethnic | 304 |
| International | 278 |
| Asian | 156 |
| Unknown | 13 |
| Native Hawaiian or Pacific Islander | 6 |
See racial/ethnic breakdown for all students.
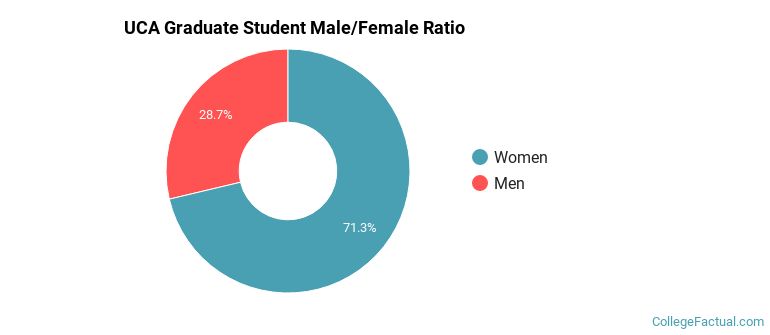
Male/Female Breakdown of Graduate Students
About 71% of full-time grad students are women, and 29% men.
For the gender breakdown for all students, go here.
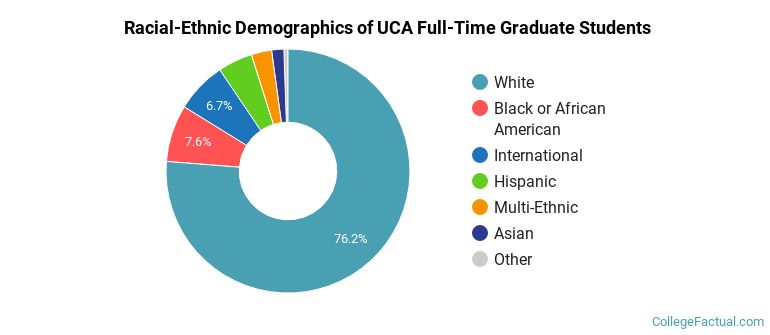
UCA Racial-Ethnic Breakdown of Graduate Students
| Race/Ethnicity | Number |
|---|---|
| White | 557 |
| International | 49 |
| Black or African American | 47 |
| Hispanic | 31 |
| Multi-Ethnic | 19 |
| Asian | 18 |
| Unknown | 4 |
| Native Hawaiian or Pacific Islander | 0 |
See racial/ethnic breakdown for all students.
| Race/Ethnicity | Number |
|---|---|
| White | 7,118 |
| Black or African American | 1,522 |
| Hispanic | 571 |
| International | 408 |
| Multi-Ethnic | 395 |
| Asian | 215 |
| Unknown | 49 |
| Native Hawaiian or Pacific Islander | 7 |
There are approximately 6,474 female students and 3,861 male students at UCA.
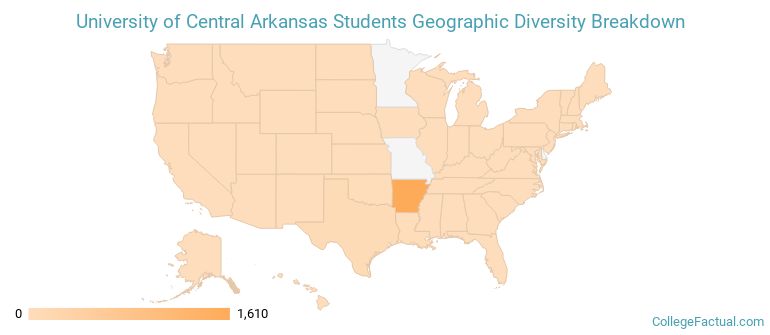
UCA ranks 1,212 out of 2,183 when it comes to geographic diversity.
9.09% of UCA students come from out of state, and 5.43% come from out of the country.
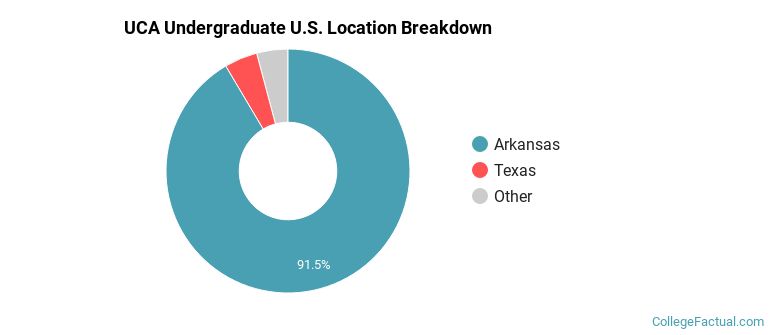
The undergraduate student body is split among 23 states (may include Washington D.C.). Click on the map for more detail.
| State | Amount |
|---|---|
| Arkansas | 1,610 |
| Texas | 77 |
| Oklahoma | 12 |
| Louisiana | 10 |
| California | 6 |
Students from 84 countries are represented at this school, with the majority of the international students coming from Côte d’Ivoire, Bahamas, and China.
Learn more about international students at UCA.
A traditional college student is defined as being between the ages of 18-21. At UCA, 57.54% of students fall into that category, compared to the national average of 60%.
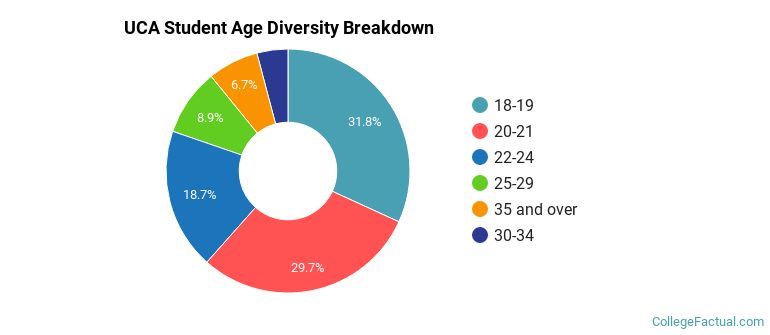
| Student Age Group | Amount |
|---|---|
| 18-19 | 3,375 |
| 20-21 | 3,152 |
| 22-24 | 1,983 |
| 25-29 | 940 |
| 35 and over | 715 |
| 30-34 | 436 |
| Under 18 | 0 |
Footnotes
*The racial-ethnic minorities count is calculated by taking the total number of students and subtracting white students, international students, and students whose race/ethnicity was unknown. This number is then divided by the total number of students at the school to obtain the racial-ethnic minorities percentage.
References
Department of Homeland Security Citizenship and Immigration Services
Image Credit: By Steve Wright Jr. (flickr user: Wright Way Photography) under License