UCF total enrollment is approximately 71,881 students. 43,513 are undergraduates and 4,955 are graduate students.
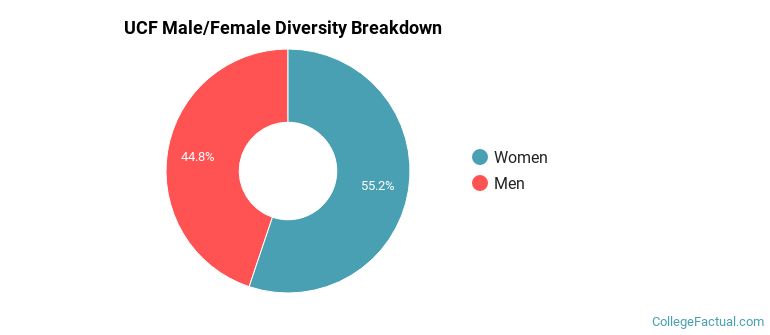
Male/Female Breakdown of Undergraduates
The full-time UCF undergraduate population is made up of 55% women, and 45% men.
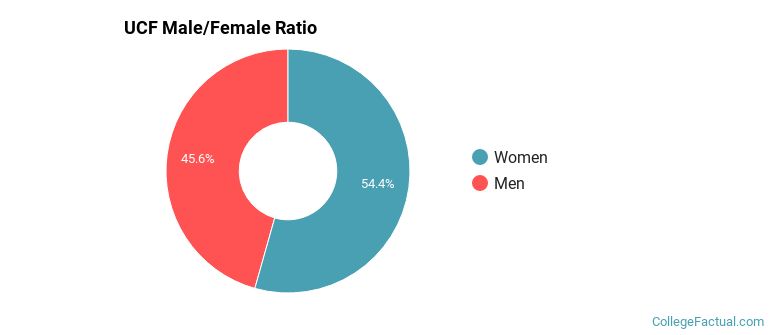
For the gender breakdown for all students, go here.
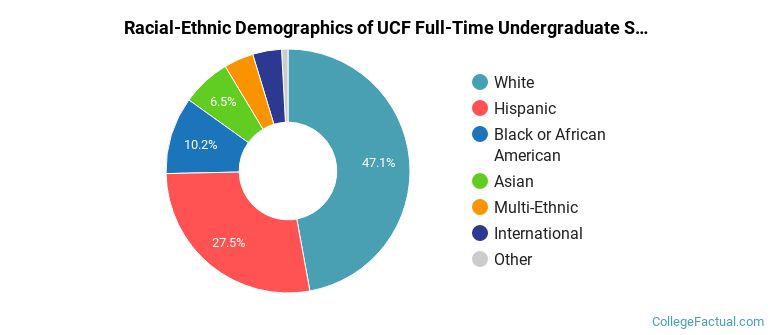
UCF Racial/Ethnic Breakdown of Undergraduates
| Race/Ethnicity | Number |
|---|---|
| White | 20,228 |
| Hispanic | 12,300 |
| Black or African American | 4,222 |
| Asian | 2,922 |
| Multi-Ethnic | 1,825 |
| International | 1,599 |
| Unknown | 305 |
| Native Hawaiian or Pacific Islander | 61 |
See racial/ethnic breakdown for all students.
Male/Female Breakdown of Graduate Students
About 56% of full-time grad students are women, and 44% men.

For the gender breakdown for all students, go here.
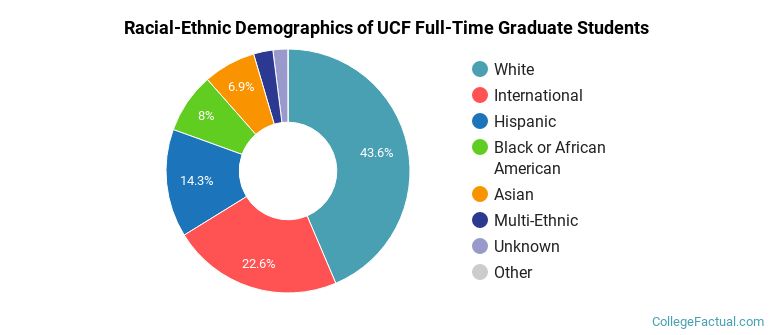
UCF Racial-Ethnic Breakdown of Graduate Students
| Race/Ethnicity | Number |
|---|---|
| White | 2,193 |
| International | 995 |
| Hispanic | 755 |
| Black or African American | 421 |
| Asian | 314 |
| Multi-Ethnic | 147 |
| Unknown | 126 |
| Native Hawaiian or Pacific Islander | 0 |
See racial/ethnic breakdown for all students.
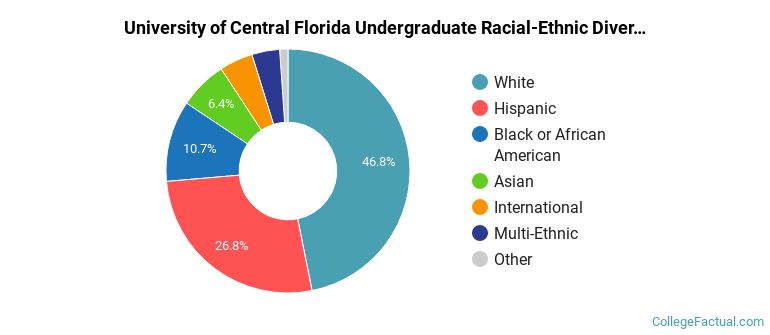
| Race/Ethnicity | Number |
|---|---|
| White | 33,280 |
| Hispanic | 19,804 |
| Black or African American | 7,411 |
| Asian | 4,618 |
| International | 3,069 |
| Multi-Ethnic | 2,815 |
| Unknown | 685 |
| Native Hawaiian or Pacific Islander | 107 |
There are approximately 40,140 female students and 31,741 male students at UCF.
UCF ranks 703 out of 2,183 when it comes to geographic diversity.
7.84% of UCF students come from out of state, and 3.58% come from out of the country.
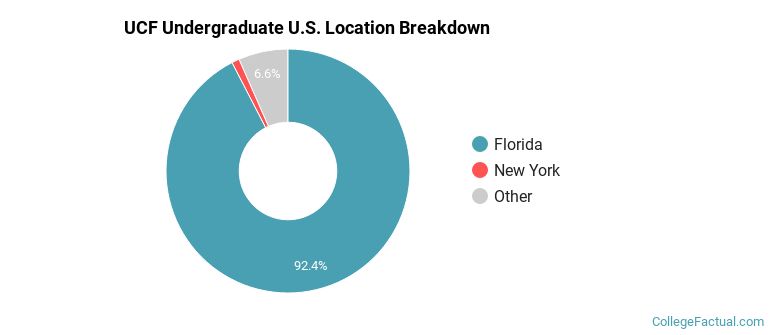
The undergraduate student body is split among 42 states (may include Washington D.C.). Click on the map for more detail.
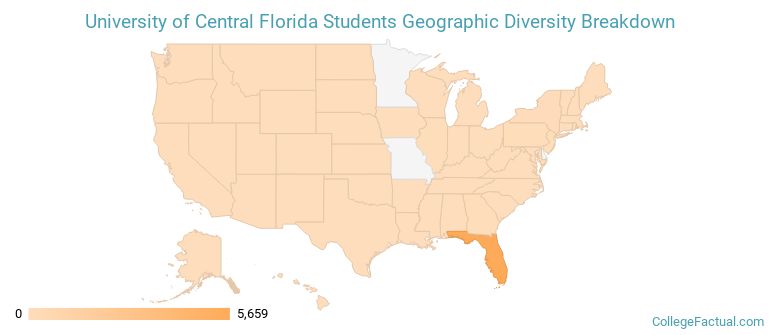
| State | Amount |
|---|---|
| Florida | 5,659 |
| New York | 62 |
| New Jersey | 52 |
| Illinois | 42 |
| Georgia | 40 |
Students from 131 countries are represented at this school, with the majority of the international students coming from China, India, and Saudi Arabia.
Learn more about international students at UCF.
A traditional college student is defined as being between the ages of 18-21. At UCF, 47.76% of students fall into that category, compared to the national average of 60%.
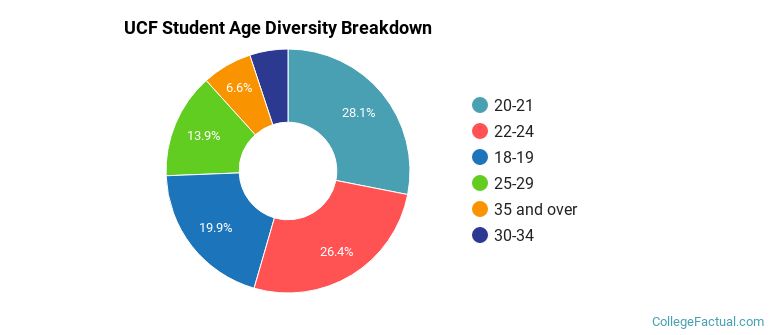
| Student Age Group | Amount |
|---|---|
| 20-21 | 18,470 |
| 22-24 | 17,349 |
| 18-19 | 13,077 |
| 25-29 | 9,152 |
| 35 and over | 4,363 |
| 30-34 | 3,332 |
| Under 18 | 0 |
Footnotes
*The racial-ethnic minorities count is calculated by taking the total number of students and subtracting white students, international students, and students whose race/ethnicity was unknown. This number is then divided by the total number of students at the school to obtain the racial-ethnic minorities percentage.
References
Department of Homeland Security Citizenship and Immigration Services
Image Credit: By Breezy Baldwin under License