UCM total enrollment is approximately 9,959 students. 6,009 are undergraduates and 765 are graduate students.
Male/Female Breakdown of Undergraduates
The full-time UCM undergraduate population is made up of 55% women, and 45% men.
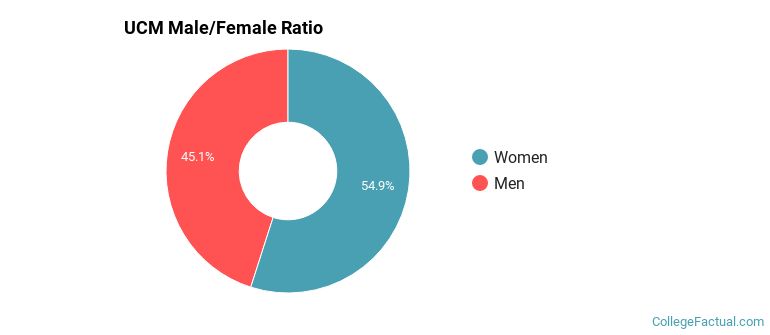
For the gender breakdown for all students, go here.
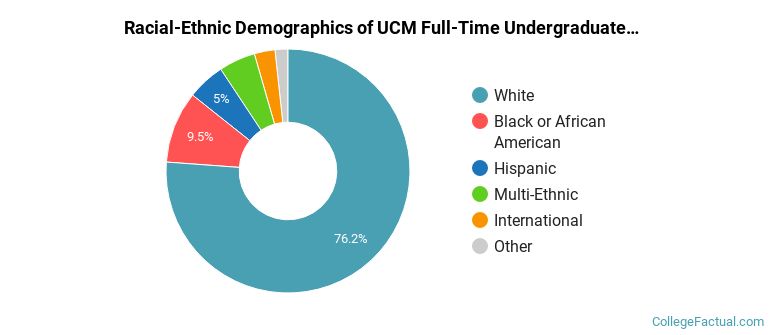
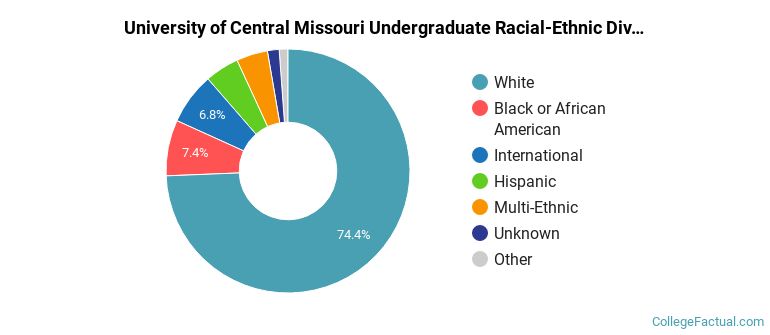
UCM Racial/Ethnic Breakdown of Undergraduates
| Race/Ethnicity | Number |
|---|---|
| White | 4,651 |
| Black or African American | 543 |
| Hispanic | 333 |
| Multi-Ethnic | 296 |
| International | 70 |
| Asian | 51 |
| Unknown | 34 |
| Native Hawaiian or Pacific Islander | 13 |
See racial/ethnic breakdown for all students.
Male/Female Breakdown of Graduate Students
About 58% of full-time grad students are women, and 42% men.
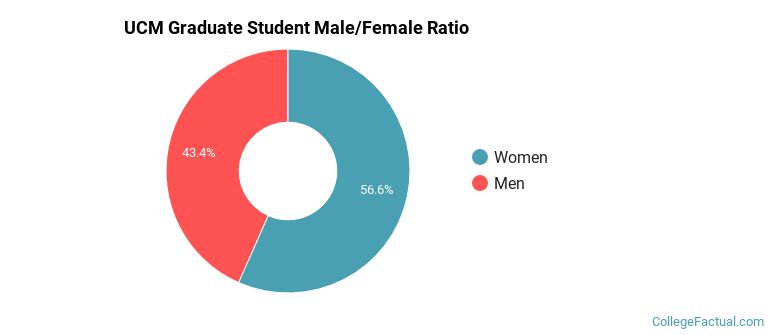
For the gender breakdown for all students, go here.
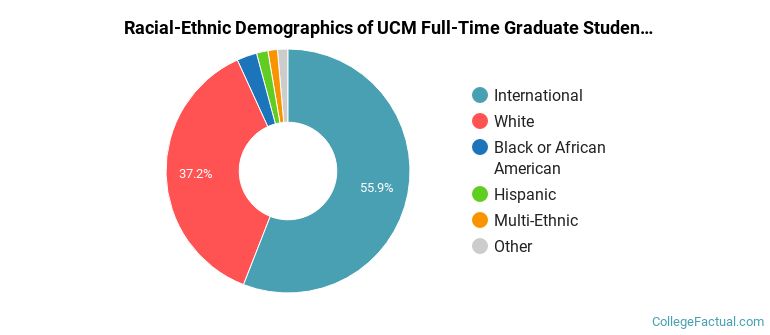
UCM Racial-Ethnic Breakdown of Graduate Students
| Race/Ethnicity | Number |
|---|---|
| International | 398 |
| White | 302 |
| Black or African American | 31 |
| Multi-Ethnic | 13 |
| Hispanic | 12 |
| Unknown | 4 |
| Asian | 3 |
| Native Hawaiian or Pacific Islander | 1 |
See racial/ethnic breakdown for all students.
| Race/Ethnicity | Number |
|---|---|
| White | 7,438 |
| Black or African American | 750 |
| International | 621 |
| Hispanic | 479 |
| Multi-Ethnic | 402 |
| Unknown | 127 |
| Asian | 98 |
| Native Hawaiian or Pacific Islander | 17 |

There are approximately 5,801 female students and 4,158 male students at UCM.
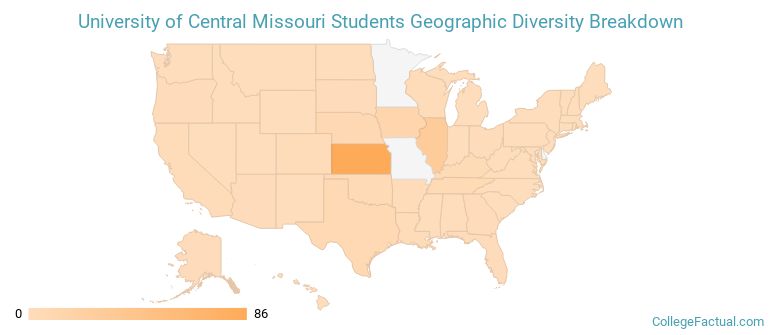
UCM ranks 1,313 out of 2,183 when it comes to geographic diversity.
11.34% of UCM students come from out of state, and 1.12% come from out of the country.
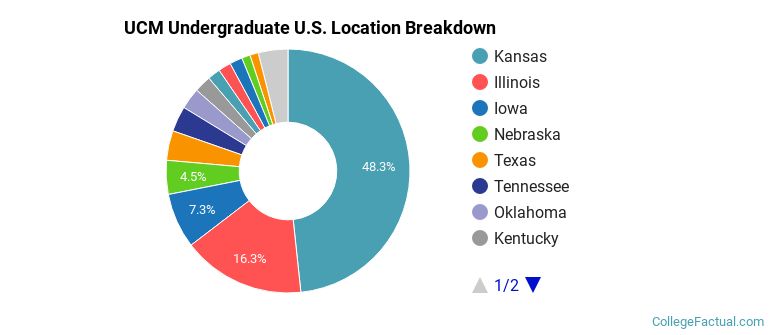
The undergraduate student body is split among 20 states (may include Washington D.C.). Click on the map for more detail.
| State | Amount |
|---|---|
| Kansas | 86 |
| Illinois | 29 |
| Iowa | 13 |
| Nebraska | 8 |
| Texas | 7 |
Students from 67 countries are represented at this school, with the majority of the international students coming from India, Saudi Arabia, and Nepal.
Learn more about international students at UCM.
A traditional college student is defined as being between the ages of 18-21. At UCM, 47.77% of students fall into that category, compared to the national average of 60%.
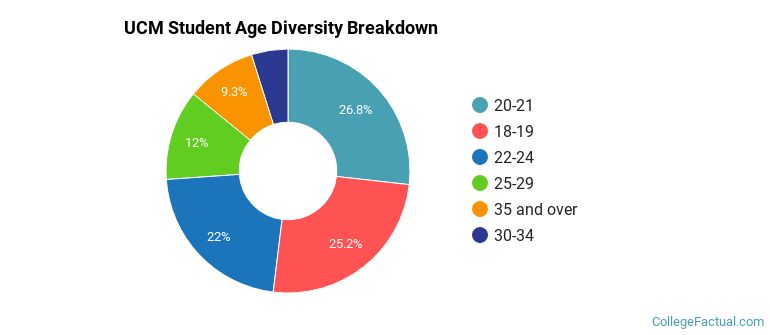
| Student Age Group | Amount |
|---|---|
| 20-21 | 3,038 |
| 18-19 | 2,853 |
| 22-24 | 2,490 |
| 25-29 | 1,359 |
| 35 and over | 1,053 |
| 30-34 | 550 |
| Under 18 | 0 |
Footnotes
*The racial-ethnic minorities count is calculated by taking the total number of students and subtracting white students, international students, and students whose race/ethnicity was unknown. This number is then divided by the total number of students at the school to obtain the racial-ethnic minorities percentage.
References