We've gathered data and other essential information about the program, such as the average salary of graduates, ethnicity of students, how many students graduated in recent times, and more. Also, learn how UCO ranks among other schools offering degrees in design.
Go directly to any of the following sections:
Learn about start dates, transferring credits, availability of financial aid, and more by contacting the universities below.
BA in Graphic Design & Media Arts
Translate your creative ideas through concept, design and digital media with a bachelor's in graphic design online from Southern New Hampshire University.
Take the first step toward a career of visual expression and doing what you love with this online associate degree from Southern New Hampshire University.
Learn to create a striking portfolio and hone the skills you need to succeed in the world of professional photography with this online digital photography degree from Southern New Hampshire University.
The bachelor's program at UCO was ranked #195 on College Factual's Best Schools for design list. It is also ranked #3 in Oklahoma.
| Ranking Type | Rank |
|---|---|
| Best Design & Applied Arts Bachelor’s Degree Schools | 162 |
| Best Design & Applied Arts Schools | 195 |
During the 2021-2022 academic year, University of Central Oklahoma handed out 30 bachelor's degrees in design & applied arts. This is an increase of 7% over the previous year when 28 degrees were handed out.
In 2022, 2 students received their master’s degree in design from UCO. This makes it the #91 most popular school for design master’s degree candidates in the country.
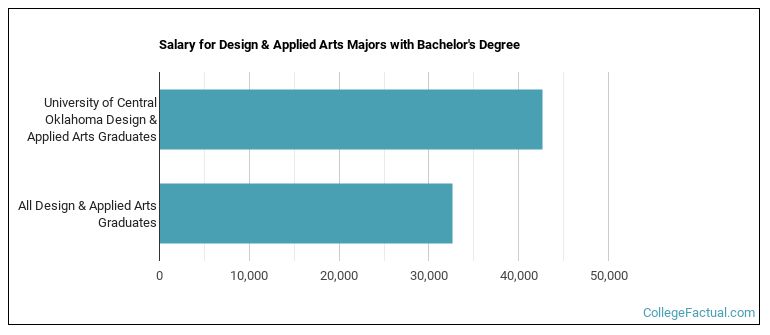
Design majors who earn their bachelor's degree from UCO go on to jobs where they make a median salary of $42,619 a year. This is higher than $32,606, which is the national median for all design bachelor's degree recipients.
Learn about other programs related to Design & Applied Arts that might interest you.
Get on the right path to the fast-paced, exciting world of video game art and design with this online bachelor's from Southern New Hampshire University.
BA in Graphic Design & Media Arts - Web Design
Gain a solid grounding in your online web design classes and exercise your creative muscle with this specialized online bachelor's from Southern New Hampshire University.
In 2022-2023, the average part-time undergraduate tuition at UCO was $606 per credit hour for out-of-state students. The average for in-state students was $243 per credit hour. The average full-time tuition and fees for undergraduates are shown in the table below.
| In State | Out of State | |
|---|---|---|
| Tuition | $7,284 | $18,171 |
| Fees | $1,238 | $1,238 |
| Books and Supplies | $1,600 | $1,600 |
| On Campus Room and Board | $8,886 | $8,886 |
| On Campus Other Expenses | $8,160 | $8,160 |
Learn more about UCO tuition and fees.
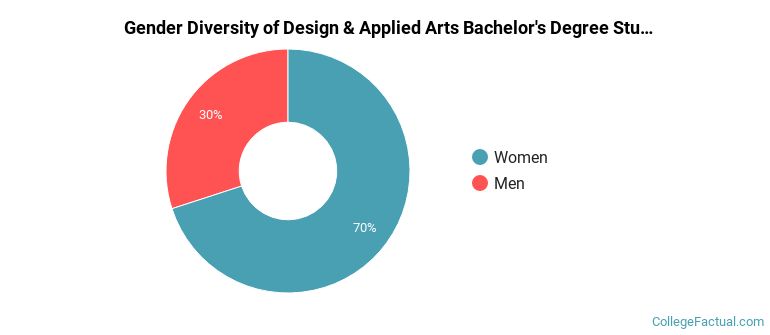
During the 2021-2022 academic year, 30 design majors earned their bachelor's degree from UCO. Of these graduates, 30% were men and 70% were women.
The following table and chart show the ethnic background for students who recently graduated from University of Central Oklahoma with a bachelor's in design.
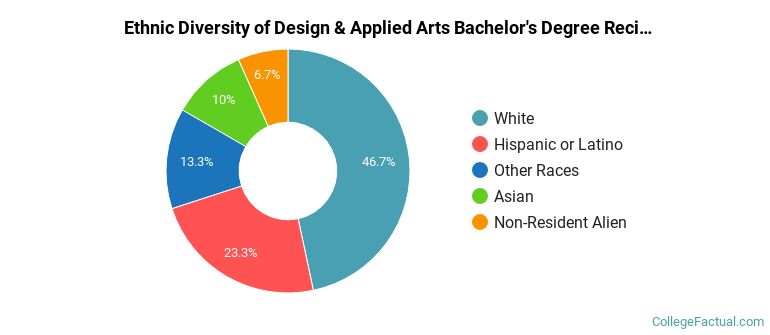
| Ethnic Background | Number of Students |
|---|---|
| Asian | 3 |
| Black or African American | 0 |
| Hispanic or Latino | 7 |
| White | 14 |
| Non-Resident Aliens | 2 |
| Other Races | 4 |
UCO does not offer an online option for its design bachelor’s degree program at this time. To see if the school offers distance learning options in other areas, visit the UCO Online Learning page.
Take a look at the following statistics related to the make-up of the design majors at University of Central Oklahoma.
| Related Major | Annual Graduates |
|---|---|
| Music | 56 |
| Drama & Theater Arts | 28 |
| Arts & Media Management | 28 |
| Fine & Studio Arts | 12 |
| Dance | 4 |
More about our data sources and methodologies.
