UCO total enrollment is approximately 14,132 students. 9,200 are undergraduates and 552 are graduate students.
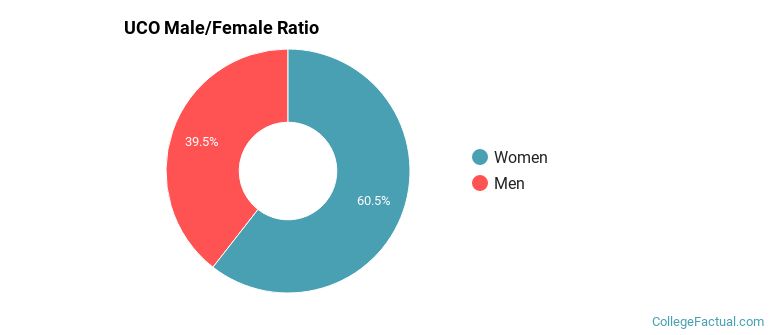
Male/Female Breakdown of Undergraduates
The full-time UCO undergraduate population is made up of 63% women, and 37% men.
For the gender breakdown for all students, go here.
UCO Racial/Ethnic Breakdown of Undergraduates
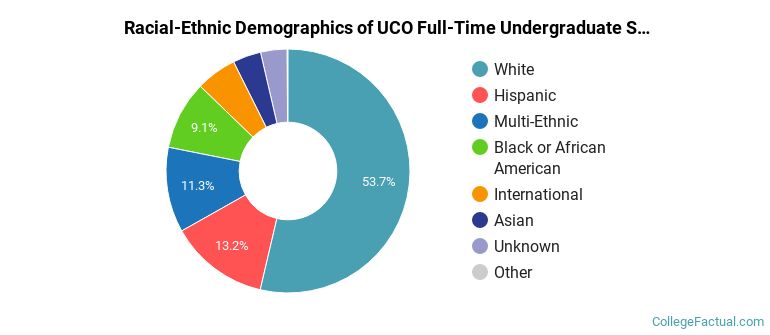
| Race/Ethnicity | Number |
|---|---|
| White | 4,760 |
| Hispanic | 1,238 |
| Multi-Ethnic | 1,072 |
| Black or African American | 808 |
| Asian | 361 |
| International | 323 |
| Unknown | 293 |
| Native Hawaiian or Pacific Islander | 13 |
See racial/ethnic breakdown for all students.
Male/Female Breakdown of Graduate Students
About 67% of full-time grad students are women, and 33% men.

For the gender breakdown for all students, go here.
UCO Racial-Ethnic Breakdown of Graduate Students
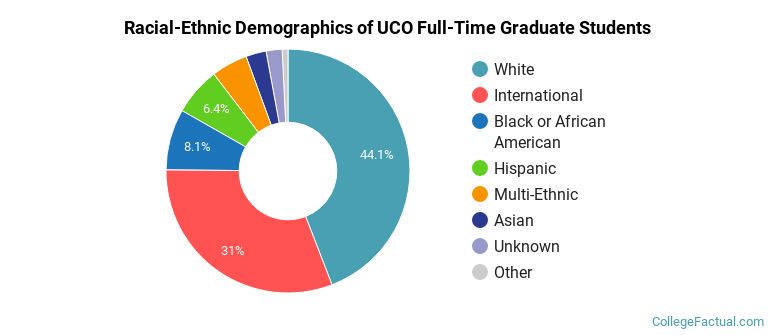
| Race/Ethnicity | Number |
|---|---|
| White | 261 |
| International | 126 |
| Hispanic | 40 |
| Black or African American | 37 |
| Multi-Ethnic | 36 |
| Unknown | 19 |
| Asian | 15 |
| Native Hawaiian or Pacific Islander | 1 |
See racial/ethnic breakdown for all students.
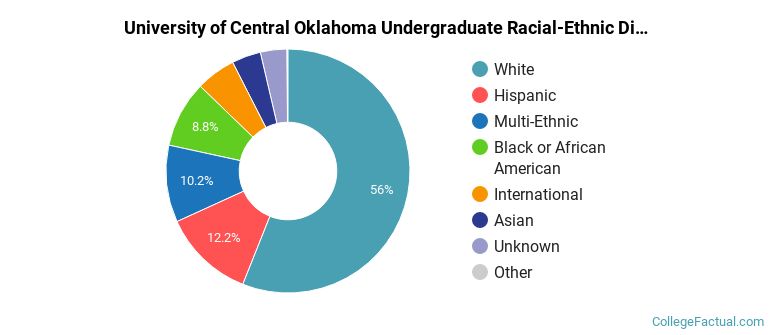
| Race/Ethnicity | Number |
|---|---|
| White | 7,575 |
| Hispanic | 1,771 |
| Multi-Ethnic | 1,484 |
| Black or African American | 1,241 |
| Asian | 582 |
| International | 535 |
| Unknown | 437 |
| Native Hawaiian or Pacific Islander | 19 |
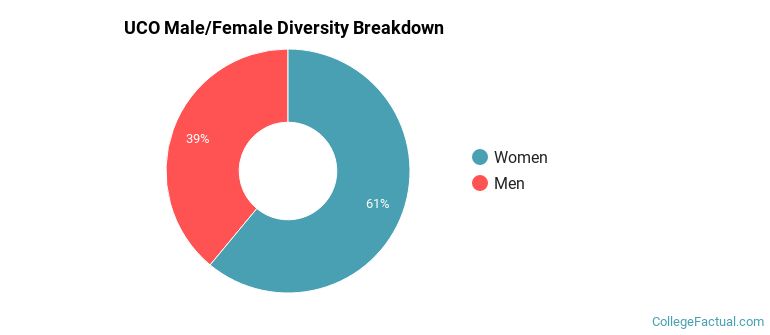
There are approximately 8,828 female students and 5,304 male students at UCO.
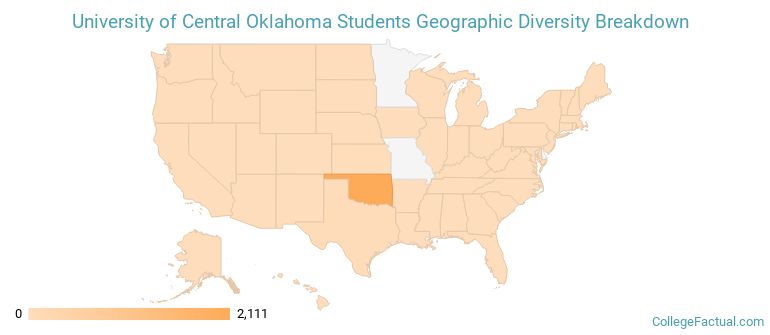
UCO ranks 1,544 out of 2,183 when it comes to geographic diversity.
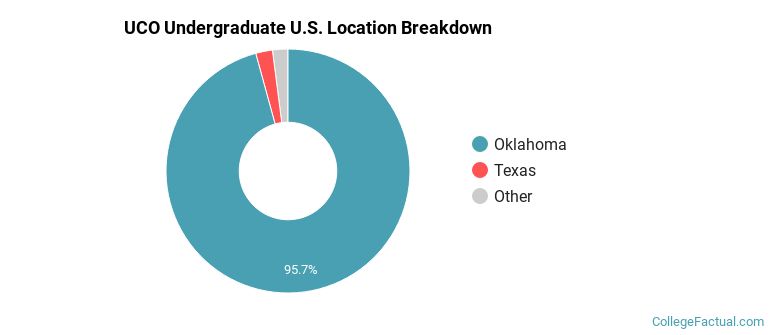
4.44% of UCO students come from out of state, and 6.28% come from out of the country.
The undergraduate student body is split among 18 states (may include Washington D.C.). Click on the map for more detail.
| State | Amount |
|---|---|
| Oklahoma | 2,111 |
| Texas | 49 |
| Kansas | 14 |
| Arkansas | 8 |
| Illinois | 4 |
Students from 92 countries are represented at this school, with the majority of the international students coming from Saudi Arabia, Nepal, and China.
Learn more about international students at UCO.
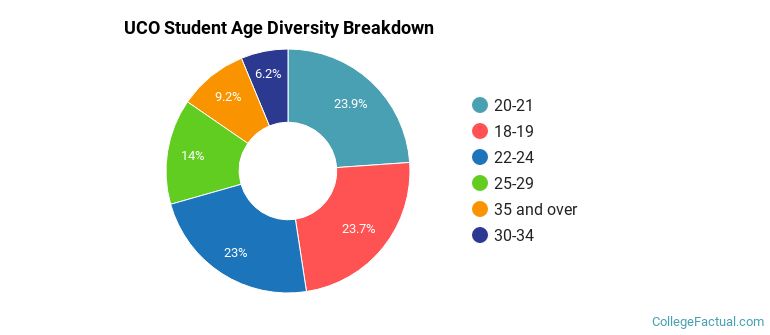
A traditional college student is defined as being between the ages of 18-21. At UCO, 45.92% of students fall into that category, compared to the national average of 60%.
| Student Age Group | Amount |
|---|---|
| 20-21 | 3,683 |
| 18-19 | 3,654 |
| 22-24 | 3,550 |
| 25-29 | 2,157 |
| 35 and over | 1,415 |
| 30-34 | 962 |
| Under 18 | 0 |
Footnotes
*The racial-ethnic minorities count is calculated by taking the total number of students and subtracting white students, international students, and students whose race/ethnicity was unknown. This number is then divided by the total number of students at the school to obtain the racial-ethnic minorities percentage.
References
Department of Homeland Security Citizenship and Immigration Services
Image Credit: By Houstonman6 under License