UC total enrollment is approximately 2,967 students. 1,189 are undergraduates and 691 are graduate students.
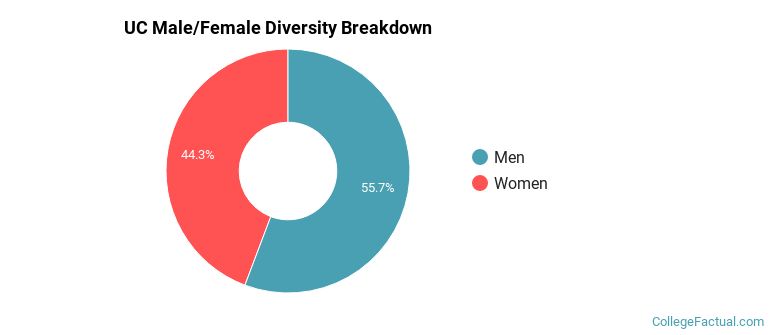
Male/Female Breakdown of Undergraduates
The full-time UC undergraduate population is made up of 55% women, and 45% men.
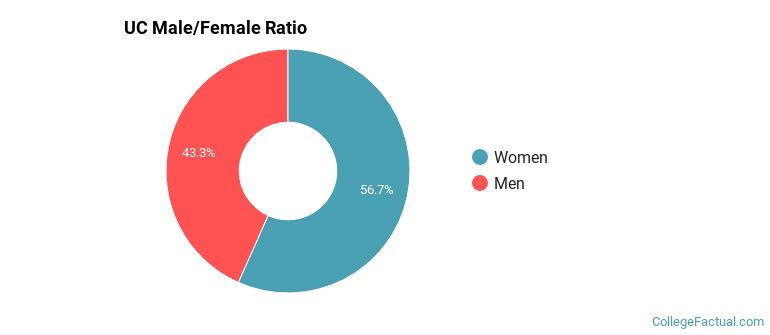
For the gender breakdown for all students, go here.
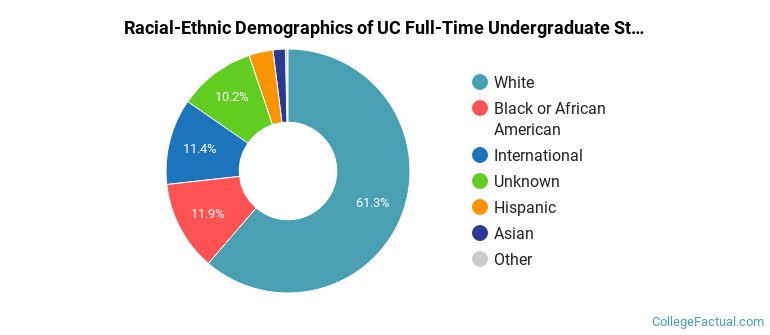
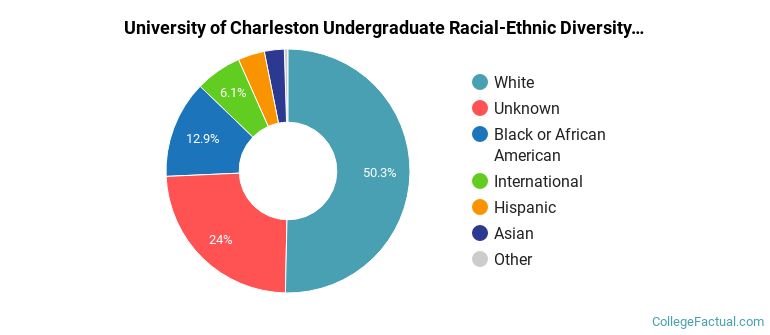
UC Racial/Ethnic Breakdown of Undergraduates
| Race/Ethnicity | Number |
|---|---|
| White | 723 |
| Black or African American | 154 |
| International | 126 |
| Unknown | 103 |
| Hispanic | 36 |
| Asian | 21 |
| Native Hawaiian or Pacific Islander | 5 |
| Multi-Ethnic | 0 |
See racial/ethnic breakdown for all students.
Male/Female Breakdown of Graduate Students
About 42% of full-time grad students are women, and 58% men.
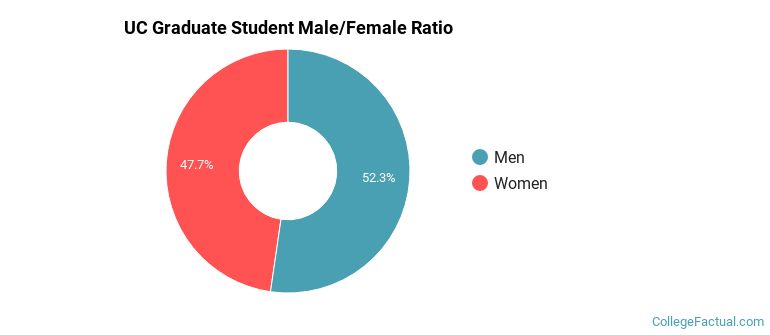
For the gender breakdown for all students, go here.
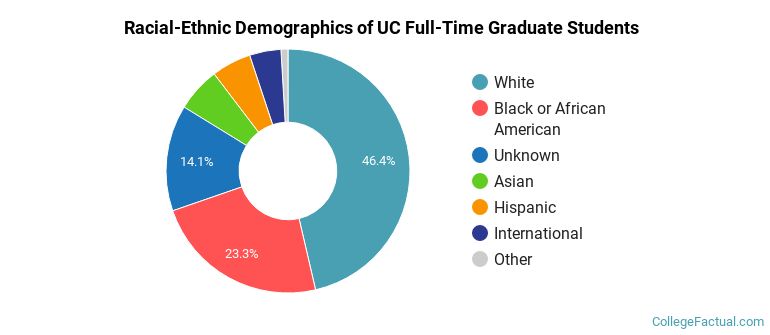
UC Racial-Ethnic Breakdown of Graduate Students
| Race/Ethnicity | Number |
|---|---|
| White | 343 |
| Black or African American | 130 |
| Unknown | 102 |
| Hispanic | 45 |
| Asian | 33 |
| International | 25 |
| Native Hawaiian or Pacific Islander | 1 |
| Multi-Ethnic | 0 |
See racial/ethnic breakdown for all students.
| Race/Ethnicity | Number |
|---|---|
| White | 1,521 |
| Unknown | 631 |
| Black or African American | 381 |
| International | 155 |
| Hispanic | 149 |
| Asian | 72 |
| Native Hawaiian or Pacific Islander | 10 |
| Multi-Ethnic | 0 |
There are approximately 1,227 female students and 1,740 male students at UC.
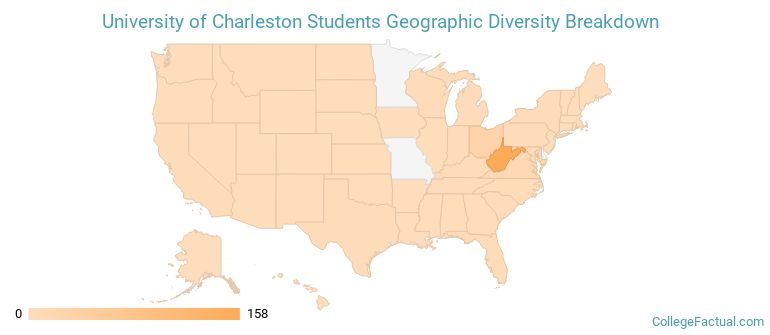
UC ranks 566 out of 2,183 when it comes to geographic diversity.
40.38% of UC students come from out of state, and 12.83% come from out of the country.
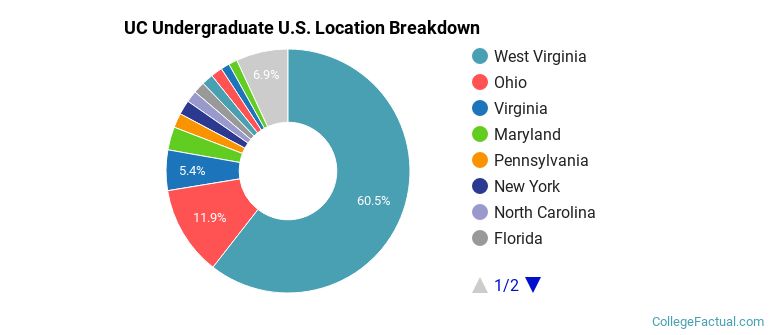
The undergraduate student body is split among 25 states (may include Washington D.C.). Click on the map for more detail.
| State | Amount |
|---|---|
| West Virginia | 158 |
| Ohio | 31 |
| Virginia | 14 |
| Maryland | 8 |
| New York | 5 |
Students from 48 countries are represented at this school, with the majority of the international students coming from Canada, United Kingdom, and Brazil.
Learn more about international students at UC.
A traditional college student is defined as being between the ages of 18-21. At UC, 36.80% of students fall into that category, compared to the national average of 60%.
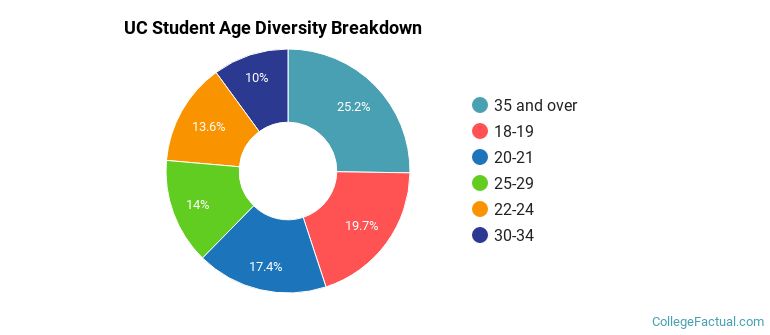
| Student Age Group | Amount |
|---|---|
| 35 and over | 621 |
| 18-19 | 485 |
| 20-21 | 428 |
| 25-29 | 345 |
| 22-24 | 334 |
| 30-34 | 247 |
| Under 18 | 0 |
Footnotes
*The racial-ethnic minorities count is calculated by taking the total number of students and subtracting white students, international students, and students whose race/ethnicity was unknown. This number is then divided by the total number of students at the school to obtain the racial-ethnic minorities percentage.
References