UChicago total enrollment is approximately 17,834 students. 7,020 are undergraduates and 8,590 are graduate students.
Male/Female Breakdown of Undergraduates
The full-time UChicago undergraduate population is made up of 48% women, and 52% men.

For the gender breakdown for all students, go here.
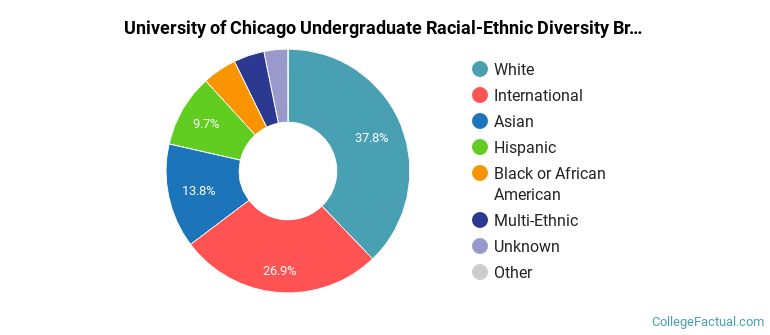
UChicago Racial/Ethnic Breakdown of Undergraduates

| Race/Ethnicity | Number |
|---|---|
| White | 2,497 |
| Asian | 1,429 |
| International | 1,059 |
| Hispanic | 1,025 |
| Multi-Ethnic | 508 |
| Black or African American | 383 |
| Unknown | 114 |
| Native Hawaiian or Pacific Islander | 2 |
See racial/ethnic breakdown for all students.
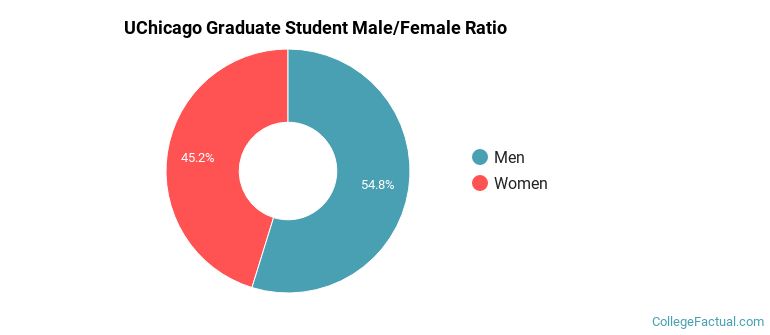
Male/Female Breakdown of Graduate Students
About 45% of full-time grad students are women, and 55% men.
For the gender breakdown for all students, go here.
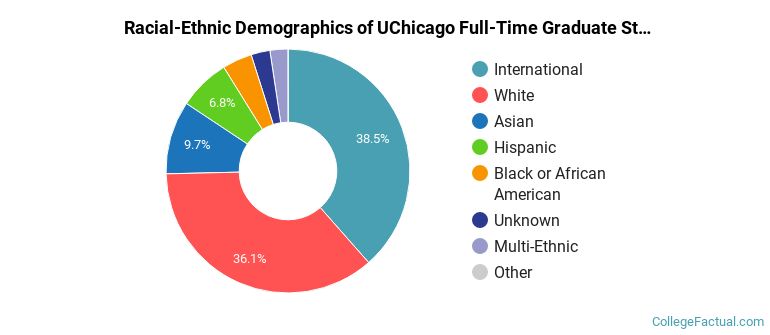
UChicago Racial-Ethnic Breakdown of Graduate Students
| Race/Ethnicity | Number |
|---|---|
| International | 3,253 |
| White | 3,053 |
| Asian | 877 |
| Hispanic | 619 |
| Black or African American | 365 |
| Multi-Ethnic | 211 |
| Unknown | 205 |
| Native Hawaiian or Pacific Islander | 1 |
See racial/ethnic breakdown for all students.
| Race/Ethnicity | Number |
|---|---|
| White | 6,577 |
| International | 4,748 |
| Asian | 2,650 |
| Hispanic | 1,773 |
| Black or African American | 839 |
| Multi-Ethnic | 763 |
| Unknown | 469 |
| Native Hawaiian or Pacific Islander | 4 |

There are approximately 8,103 female students and 9,731 male students at UChicago.
UChicago ranks 30 out of 2,183 when it comes to geographic diversity.
81.95% of UChicago students come from out of state, and 15.02% come from out of the country.
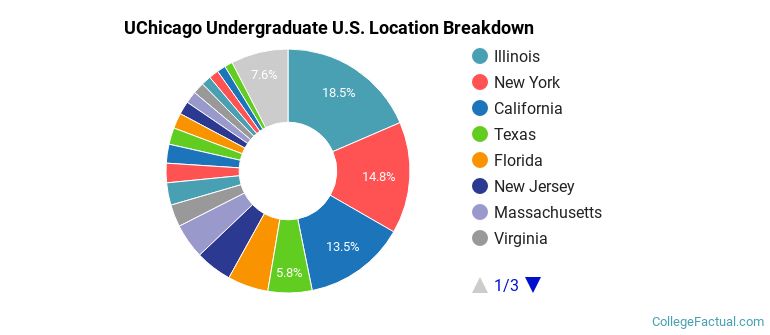
The undergraduate student body is split among 46 states (may include Washington D.C.). Click on the map for more detail.
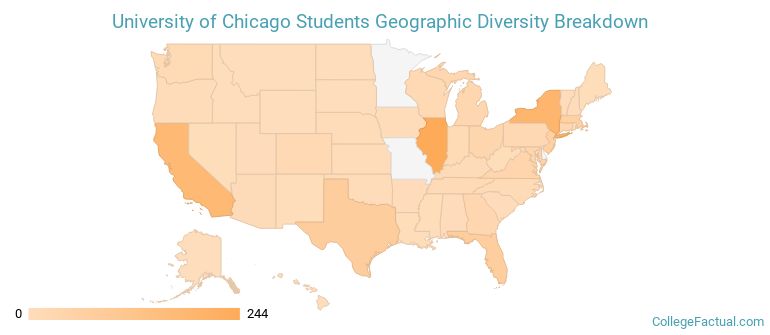
| State | Amount |
|---|---|
| Illinois | 244 |
| New York | 195 |
| California | 178 |
| Texas | 77 |
| Florida | 71 |
Students from 117 countries are represented at this school, with the majority of the international students coming from China, India, and South Korea.
Learn more about international students at UChicago.
A traditional college student is defined as being between the ages of 18-21. At UChicago, 36.58% of students fall into that category, compared to the national average of 60%.
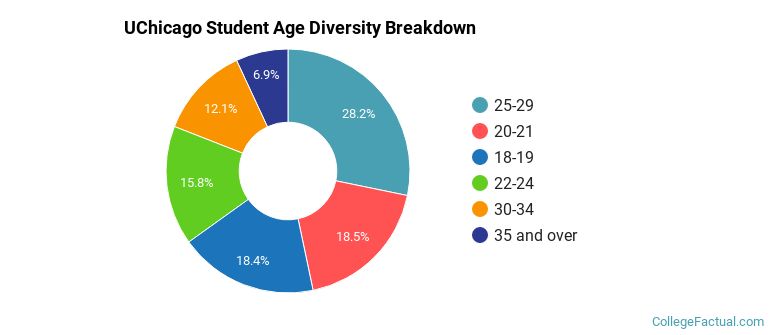
| Student Age Group | Amount |
|---|---|
| 25-29 | 4,542 |
| 20-21 | 2,973 |
| 18-19 | 2,963 |
| 22-24 | 2,548 |
| 30-34 | 1,952 |
| 35 and over | 1,115 |
| Under 18 | 0 |
Footnotes
*The racial-ethnic minorities count is calculated by taking the total number of students and subtracting white students, international students, and students whose race/ethnicity was unknown. This number is then divided by the total number of students at the school to obtain the racial-ethnic minorities percentage.
References