We've pulled together some essential information you should know about the program, including how many students graduate each year, the ethnic diversity of these students, average starting salaries, and more. In addition, we cover how UCONN ranks in comparison to other schools with bio engineering programs.
Jump to any of the following sections:
UCONN was ranked #24 on College Factual's most recent list of the best schools for bio engineering majors. This puts the bachelor's program at the school solidly in the top 15% of all colleges and universities in the country. It is also ranked #1 in Connecticut.
During the 2021-2022 academic year, University of Connecticut handed out 74 bachelor's degrees in biomedical engineering. This is a decrease of 19% over the previous year when 91 degrees were handed out.
In 2022, 24 students received their master’s degree in bio engineering from UCONN. This makes it the #46 most popular school for bio engineering master’s degree candidates in the country.
In addition, 11 students received their doctoral degrees in bio engineering in 2022, making the school the #38 most popular school in the United States for this category of students.
The median salary of bio engineering students who receive their bachelor's degree at UCONN is $66,075. This is great news for graduates of the program, since this figure is higher than the national average of $64,853 for all bio engineering bachelor's degree recipients.

While getting their bachelor's degree at UCONN, bio engineering students borrow a median amount of $55,528 in student loans. This is higher than the the typical median of $47,261 for all bio engineering majors across the country.
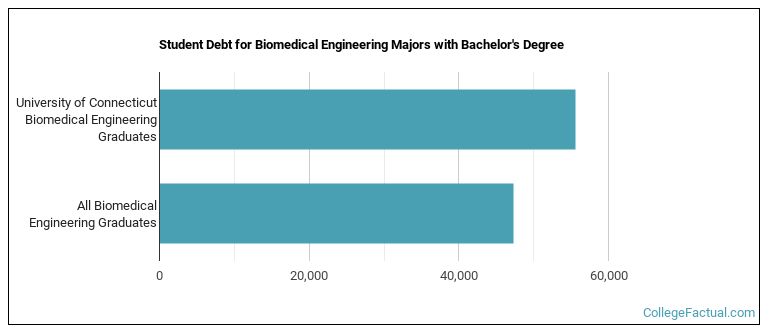
The typical student loan payment of a bachelor's degree student from the bio engineering program at UCONN is $568 per month.
Out-of-state part-time undergraduates at UCONN paid an average of $1,625 per credit hour in 2022-2023. The average for in-state students was $681 per credit hour. The following table shows the average full-time tuition and fees for undergraduates.
| In State | Out of State | |
|---|---|---|
| Tuition | $16,332 | $39,000 |
| Fees | $4,034 | $4,034 |
| Books and Supplies | $990 | $990 |
| On Campus Room and Board | $13,996 | $13,996 |
| On Campus Other Expenses | $4,330 | $4,330 |
Learn more about UCONN tuition and fees.
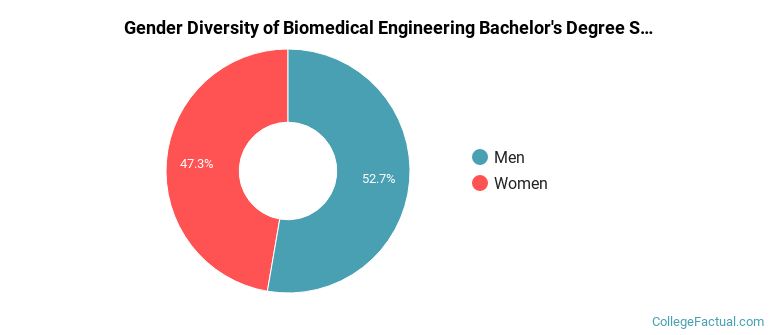
During the 2021-2022 academic year, 74 bio engineering majors earned their bachelor's degree from UCONN. Of these graduates, 53% were men and 47% were women.
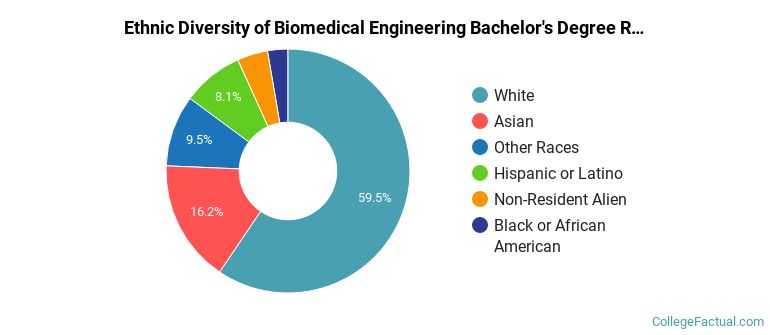
The majority of bachelor's degree recipients in this major at UCONN are white. In the most recent graduating class for which data is available, 59% of students fell into this category.
The following table and chart show the ethnic background for students who recently graduated from University of Connecticut with a bachelor's in bio engineering.
| Ethnic Background | Number of Students |
|---|---|
| Asian | 12 |
| Black or African American | 2 |
| Hispanic or Latino | 6 |
| White | 44 |
| Non-Resident Aliens | 3 |
| Other Races | 7 |
UCONN does not offer an online option for its bio engineering bachelor’s degree program at this time. To see if the school offers distance learning options in other areas, visit the UCONN Online Learning page.
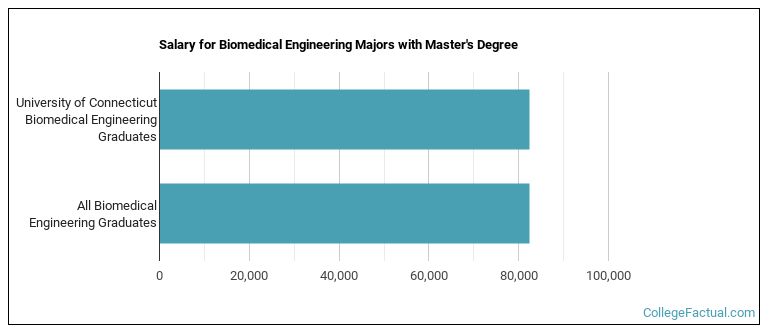
Graduates of the master's bio engineering program at UCONN make a median salary of $82,315. This is about the same as the yearly salary of allbio engineering master's degree recipients across the nation.
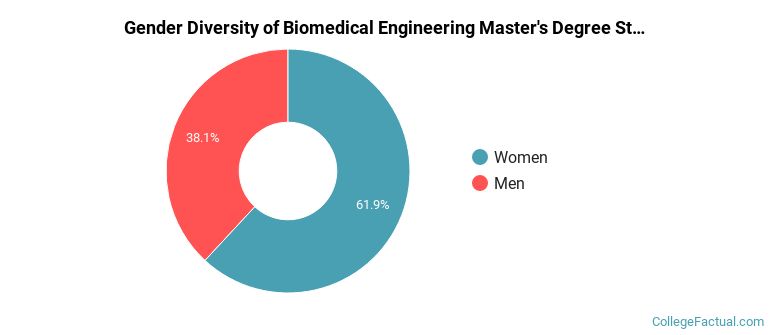
For the most recent academic year available, 38% of bio engineering master's degrees went to men and 62% went to women.
The following table and chart show the ethnic background for students who recently graduated from University of Connecticut with a master's in bio engineering.
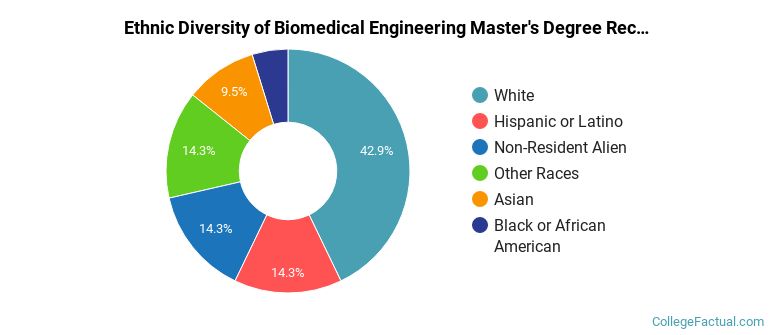
| Ethnic Background | Number of Students |
|---|---|
| Asian | 2 |
| Black or African American | 1 |
| Hispanic or Latino | 3 |
| White | 9 |
| Non-Resident Aliens | 3 |
| Other Races | 3 |
Take a look at the following statistics related to the make-up of the bio engineering majors at University of Connecticut.
| Related Major | Annual Graduates |
|---|---|
| Mechanical Engineering | 189 |
| Computer Engineering | 109 |
| Electrical Engineering | 95 |
| Civil Engineering | 88 |
| Chemical Engineering | 79 |
More about our data sources and methodologies.