UCONN total enrollment is approximately 27,215 students. 18,090 are undergraduates and 5,624 are graduate students.
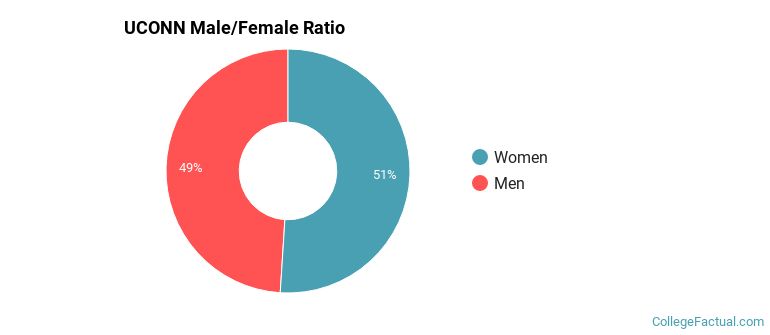
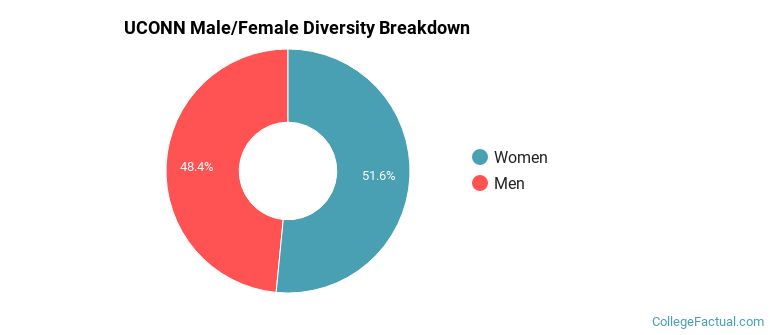
Male/Female Breakdown of Undergraduates
The full-time UCONN undergraduate population is made up of 52% women, and 48% men.
For the gender breakdown for all students, go here.
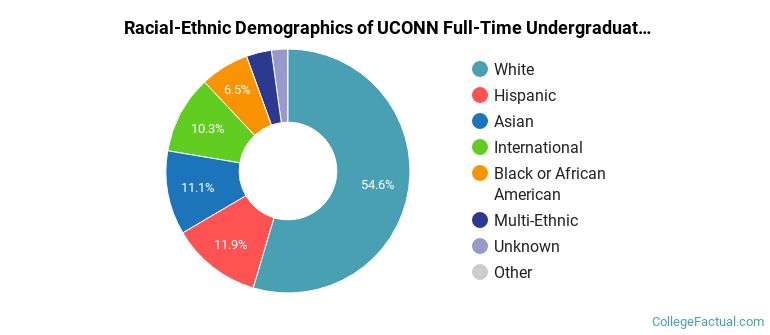
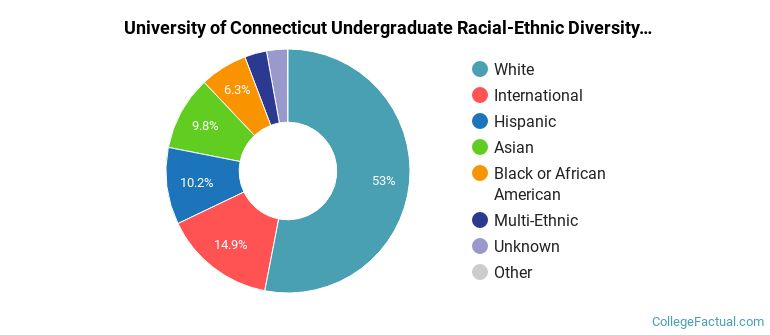
UCONN Racial/Ethnic Breakdown of Undergraduates
| Race/Ethnicity | Number |
|---|---|
| White | 9,557 |
| Hispanic | 2,393 |
| Asian | 2,133 |
| International | 1,803 |
| Black or African American | 1,204 |
| Multi-Ethnic | 670 |
| Unknown | 306 |
| Native Hawaiian or Pacific Islander | 8 |
See racial/ethnic breakdown for all students.
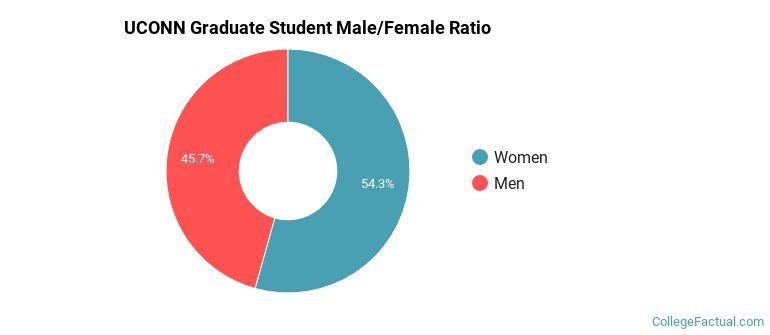
Male/Female Breakdown of Graduate Students
About 55% of full-time grad students are women, and 45% men.
For the gender breakdown for all students, go here.
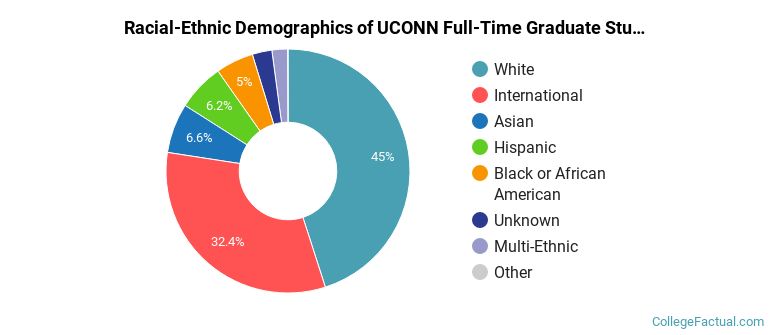
UCONN Racial-Ethnic Breakdown of Graduate Students
| Race/Ethnicity | Number |
|---|---|
| White | 2,762 |
| International | 1,485 |
| Hispanic | 424 |
| Asian | 391 |
| Black or African American | 317 |
| Multi-Ethnic | 129 |
| Unknown | 111 |
| Native Hawaiian or Pacific Islander | 2 |
See racial/ethnic breakdown for all students.
| Race/Ethnicity | Number |
|---|---|
| White | 14,432 |
| International | 3,574 |
| Hispanic | 3,151 |
| Asian | 2,789 |
| Black or African American | 1,767 |
| Multi-Ethnic | 891 |
| Unknown | 574 |
| Native Hawaiian or Pacific Islander | 12 |
There are approximately 14,262 female students and 12,953 male students at UCONN.
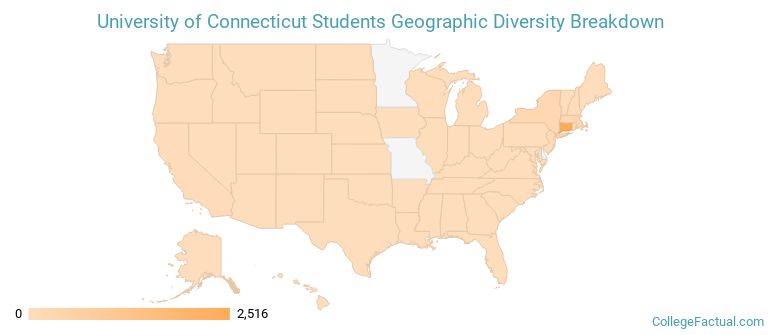
UCONN ranks 644 out of 2,183 when it comes to geographic diversity.
28.38% of UCONN students come from out of state, and 7.85% come from out of the country.
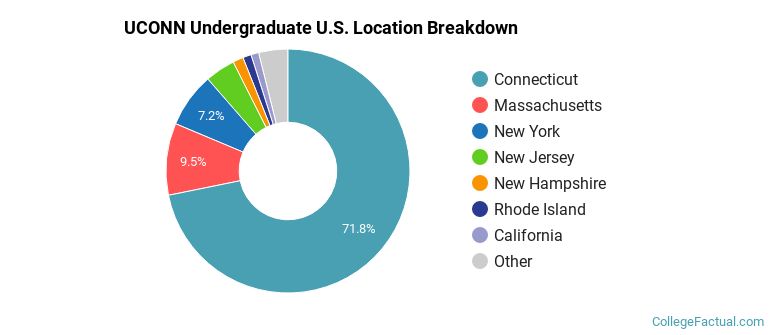
The undergraduate student body is split among 34 states (may include Washington D.C.). Click on the map for more detail.
| State | Amount |
|---|---|
| Connecticut | 2,516 |
| Massachusetts | 334 |
| New York | 254 |
| New Jersey | 140 |
| New Hampshire | 49 |
Students from 106 countries are represented at this school, with the majority of the international students coming from China, India, and South Korea.
Learn more about international students at UCONN.
A traditional college student is defined as being between the ages of 18-21. At UCONN, 60.10% of students fall into that category, compared to the national average of 60%.
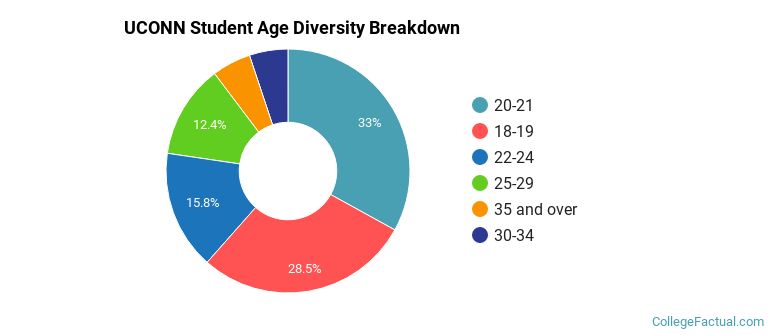
| Student Age Group | Amount |
|---|---|
| 20-21 | 8,894 |
| 18-19 | 7,679 |
| 22-24 | 4,252 |
| 25-29 | 3,338 |
| 35 and over | 1,392 |
| 30-34 | 1,379 |
| Under 18 | 0 |
Footnotes
*The racial-ethnic minorities count is calculated by taking the total number of students and subtracting white students, international students, and students whose race/ethnicity was unknown. This number is then divided by the total number of students at the school to obtain the racial-ethnic minorities percentage.
References
Department of Homeland Security Citizenship and Immigration Services
Find out how College Factual created their Diversity Rankings.