DU total enrollment is approximately 13,856 students. 5,362 are undergraduates and 3,334 are graduate students.
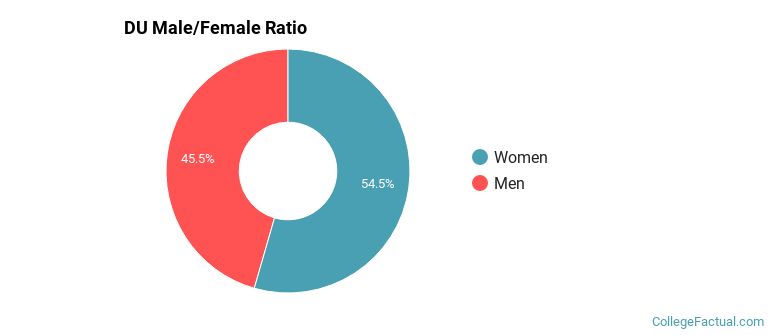
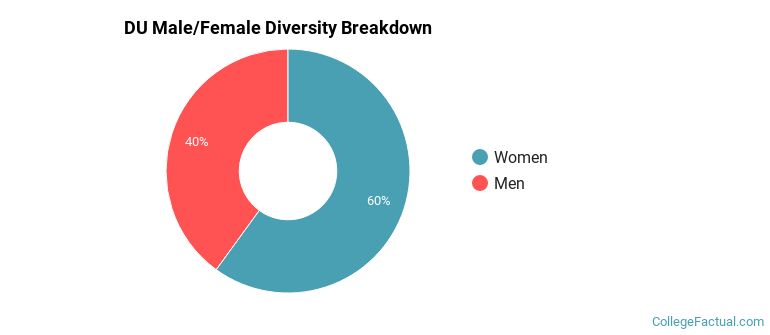
Male/Female Breakdown of Undergraduates
The full-time DU undergraduate population is made up of 55% women, and 45% men.
For the gender breakdown for all students, go here.
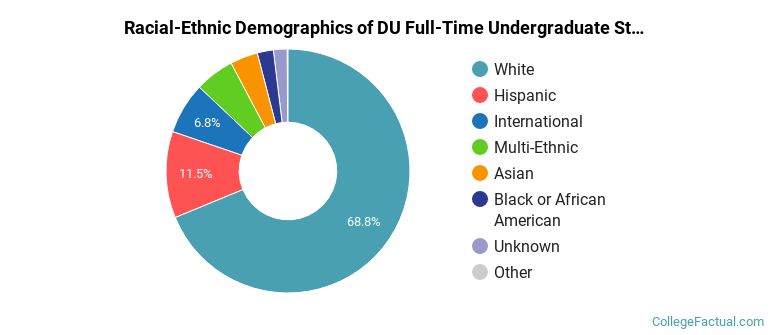
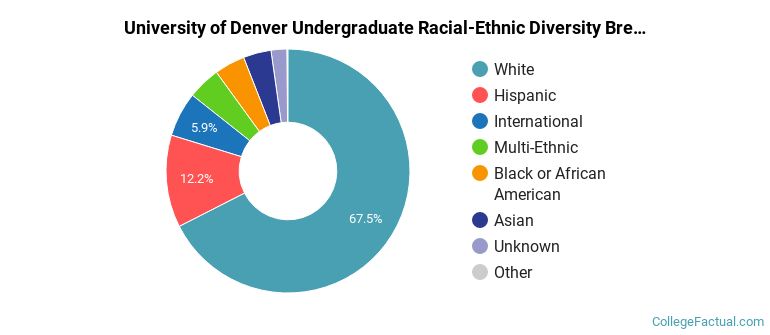
DU Racial/Ethnic Breakdown of Undergraduates
| Race/Ethnicity | Number |
|---|---|
| White | 3,669 |
| Hispanic | 682 |
| Multi-Ethnic | 298 |
| International | 273 |
| Asian | 203 |
| Black or African American | 123 |
| Unknown | 85 |
| Native Hawaiian or Pacific Islander | 7 |
See racial/ethnic breakdown for all students.
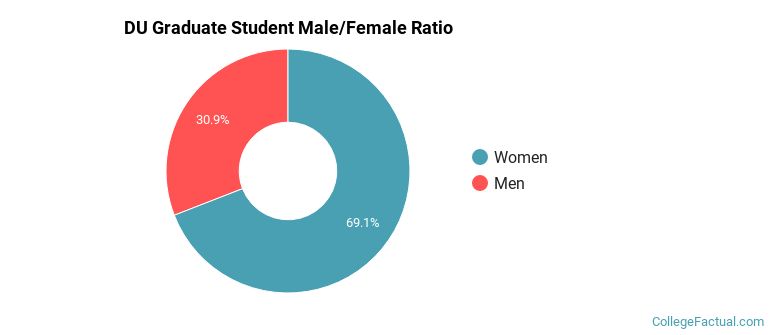
Male/Female Breakdown of Graduate Students
About 69% of full-time grad students are women, and 31% men.
For the gender breakdown for all students, go here.
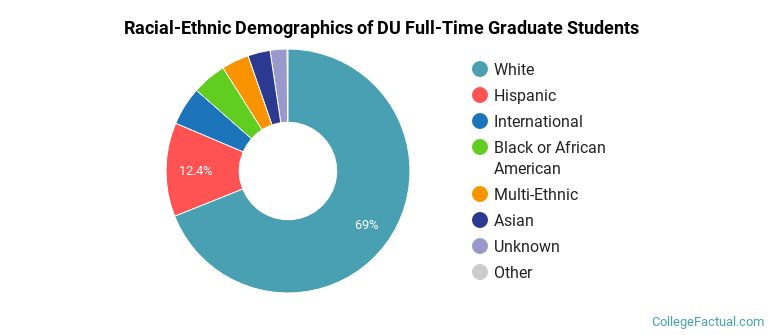
DU Racial-Ethnic Breakdown of Graduate Students
| Race/Ethnicity | Number |
|---|---|
| White | 2,290 |
| Hispanic | 426 |
| Black or African American | 152 |
| Multi-Ethnic | 139 |
| International | 127 |
| Asian | 111 |
| Unknown | 65 |
| Native Hawaiian or Pacific Islander | 7 |
See racial/ethnic breakdown for all students.
| Race/Ethnicity | Number |
|---|---|
| White | 9,285 |
| Hispanic | 1,833 |
| Multi-Ethnic | 650 |
| International | 628 |
| Black or African American | 577 |
| Asian | 550 |
| Unknown | 244 |
| Native Hawaiian or Pacific Islander | 22 |
There are approximately 8,410 female students and 5,446 male students at DU.
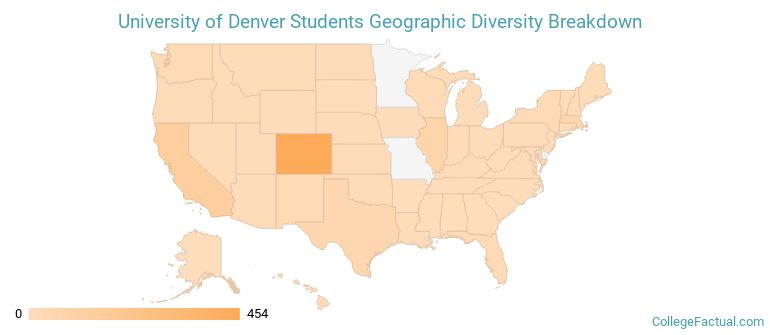
DU ranks 102 out of 2,183 when it comes to geographic diversity.
64.19% of DU students come from out of state, and 5.58% come from out of the country.
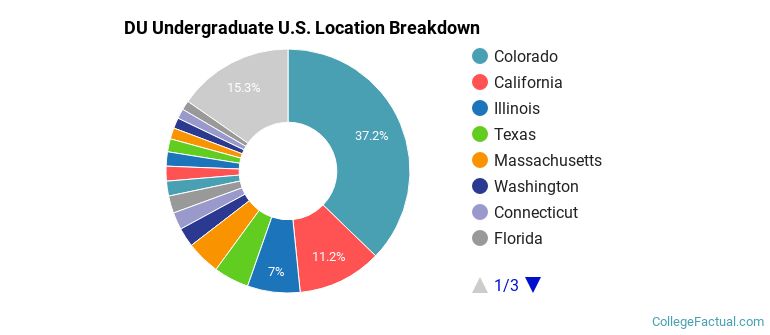
The undergraduate student body is split among 48 states (may include Washington D.C.). Click on the map for more detail.
| State | Amount |
|---|---|
| Colorado | 454 |
| California | 136 |
| Illinois | 85 |
| Texas | 57 |
| Massachusetts | 55 |
Students from 102 countries are represented at this school, with the majority of the international students coming from China, Saudi Arabia, and India.
Learn more about international students at DU.
A traditional college student is defined as being between the ages of 18-21. At DU, 42.10% of students fall into that category, compared to the national average of 60%.
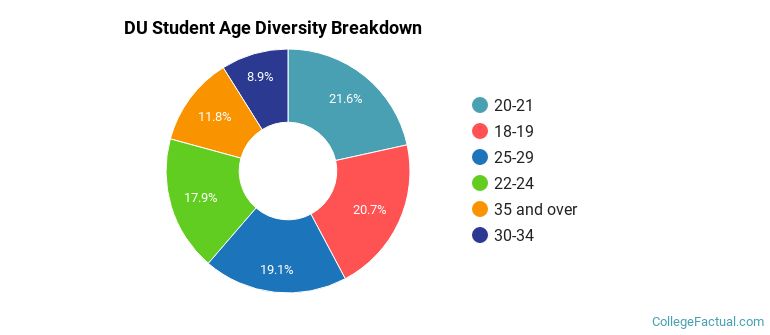
| Student Age Group | Amount |
|---|---|
| 20-21 | 2,458 |
| 18-19 | 2,356 |
| 25-29 | 2,178 |
| 22-24 | 2,042 |
| 35 and over | 1,351 |
| 30-34 | 1,016 |
| Under 18 | 0 |
Footnotes
*The racial-ethnic minorities count is calculated by taking the total number of students and subtracting white students, international students, and students whose race/ethnicity was unknown. This number is then divided by the total number of students at the school to obtain the racial-ethnic minorities percentage.
References
Department of Homeland Security Citizenship and Immigration Services
Learn more about how College Factual creates their Diversity Rankings.