UE total enrollment is approximately 2,323 students. 1,716 are undergraduates and 274 are graduate students.
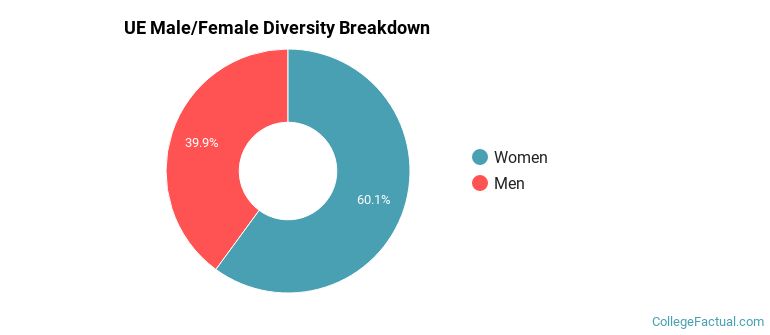
Male/Female Breakdown of Undergraduates
The full-time UE undergraduate population is made up of 59% women, and 41% men.
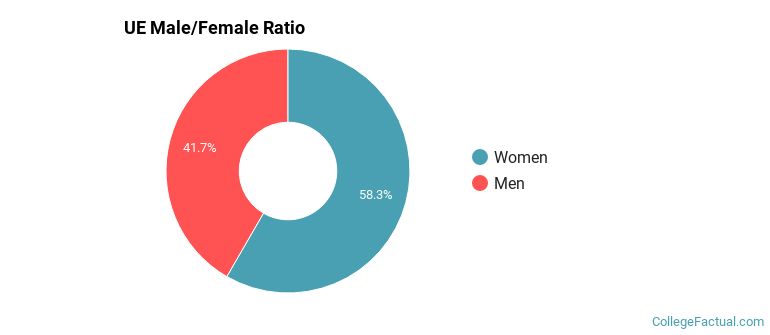
For the gender breakdown for all students, go here.
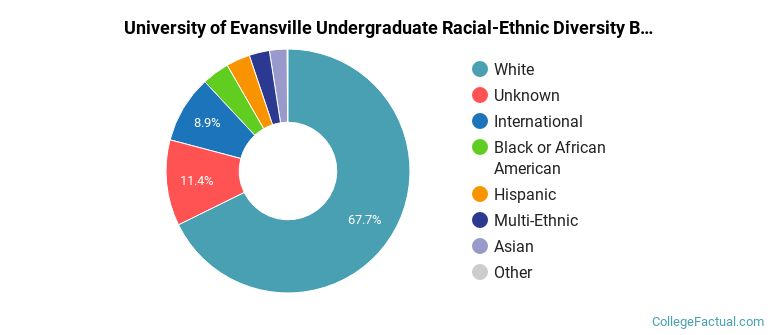
UE Racial/Ethnic Breakdown of Undergraduates
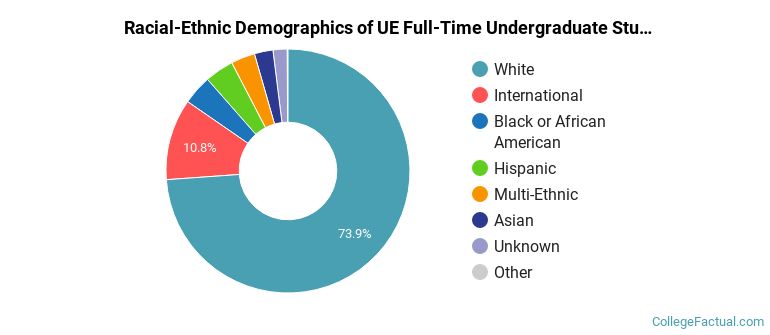
| Race/Ethnicity | Number |
|---|---|
| White | 1,328 |
| International | 138 |
| Hispanic | 70 |
| Black or African American | 64 |
| Multi-Ethnic | 56 |
| Asian | 47 |
| Unknown | 10 |
| Native Hawaiian or Pacific Islander | 2 |
See racial/ethnic breakdown for all students.
Male/Female Breakdown of Graduate Students
About 72% of full-time grad students are women, and 28% men.
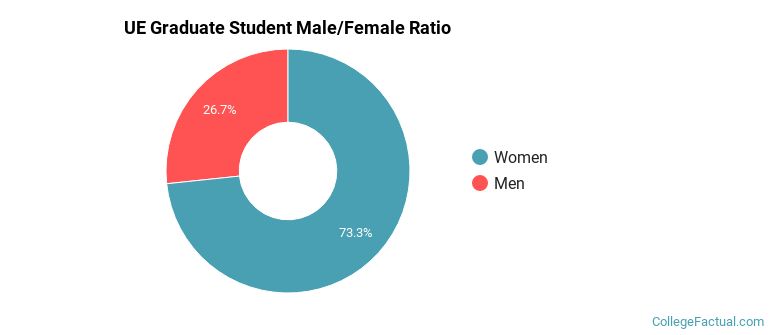
For the gender breakdown for all students, go here.
UE Racial-Ethnic Breakdown of Graduate Students
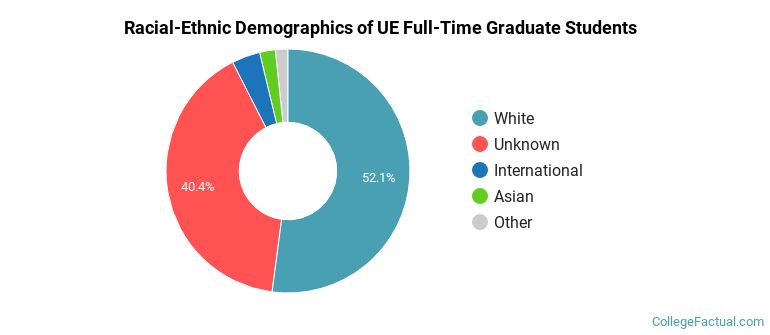
| Race/Ethnicity | Number |
|---|---|
| White | 165 |
| Unknown | 80 |
| Hispanic | 9 |
| Asian | 8 |
| International | 6 |
| Black or African American | 3 |
| Multi-Ethnic | 3 |
| Native Hawaiian or Pacific Islander | 0 |
See racial/ethnic breakdown for all students.
| Race/Ethnicity | Number |
|---|---|
| White | 1,594 |
| Unknown | 289 |
| International | 150 |
| Hispanic | 84 |
| Black or African American | 80 |
| Multi-Ethnic | 62 |
| Asian | 59 |
| Native Hawaiian or Pacific Islander | 2 |
There are approximately 1,389 female students and 934 male students at UE.
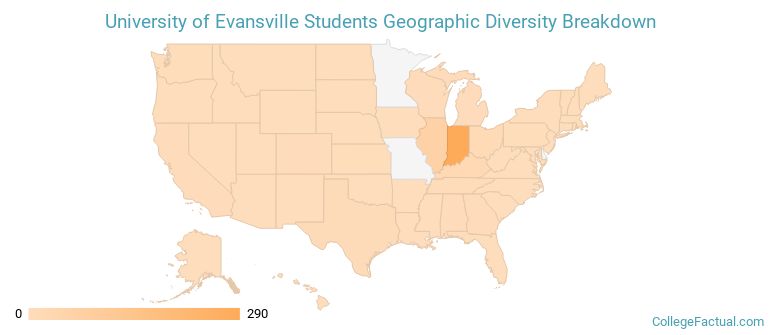
UE ranks 654 out of 2,183 when it comes to geographic diversity.
37.34% of UE students come from out of state, and 13.04% come from out of the country.
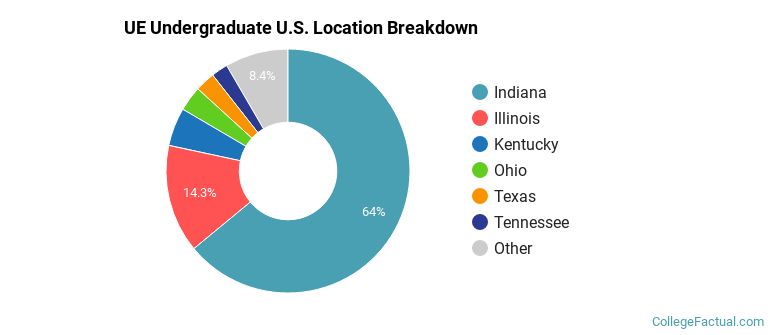
The undergraduate student body is split among 23 states (may include Washington D.C.). Click on the map for more detail.
| State | Amount |
|---|---|
| Indiana | 290 |
| Illinois | 65 |
| Kentucky | 23 |
| Ohio | 15 |
| Texas | 12 |
Students from 60 countries are represented at this school, with the majority of the international students coming from Saudi Arabia, China, and Oman.
Learn more about international students at UE.
A traditional college student is defined as being between the ages of 18-21. At UE, 67.93% of students fall into that category, compared to the national average of 60%.
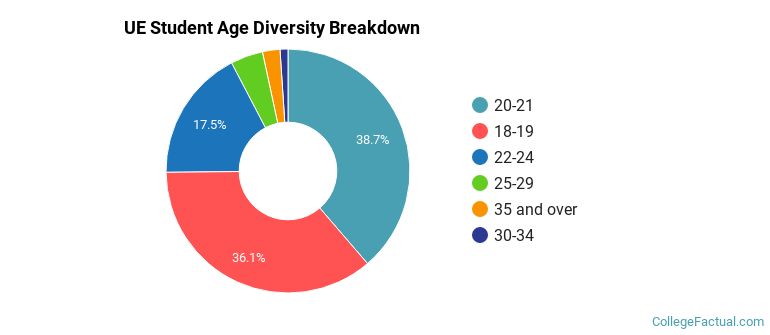
| Student Age Group | Amount |
|---|---|
| 20-21 | 884 |
| 18-19 | 825 |
| 22-24 | 400 |
| 25-29 | 98 |
| 35 and over | 53 |
| 30-34 | 24 |
| Under 18 | 0 |
Footnotes
*The racial-ethnic minorities count is calculated by taking the total number of students and subtracting white students, international students, and students whose race/ethnicity was unknown. This number is then divided by the total number of students at the school to obtain the racial-ethnic minorities percentage.
References
Department of Homeland Security Citizenship and Immigration Services
Image Credit: By Saunder James under License
Find out how College Factual created their Diversity Rankings.