UH West Oahu total enrollment is approximately 3,168 students.
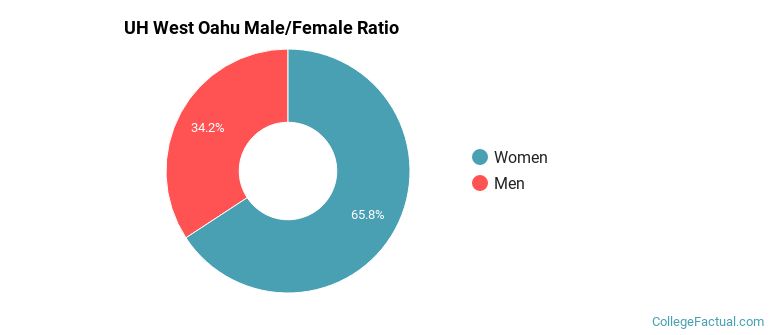
Male/Female Breakdown of Undergraduates
The full-time UH West Oahu undergraduate population is made up of 66% women, and 34% men.
For the gender breakdown for all students, go here.
UH West Oahu Racial/Ethnic Breakdown of Undergraduates
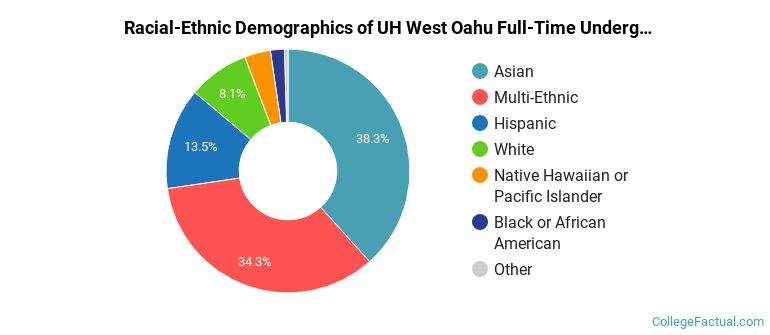
| Race/Ethnicity | Number |
|---|---|
| Asian | 650 |
| Multi-Ethnic | 592 |
| Hispanic | 264 |
| White | 148 |
| Native Hawaiian or Pacific Islander | 68 |
| Black or African American | 26 |
| International | 5 |
| Unknown | 3 |
See racial/ethnic breakdown for all students.
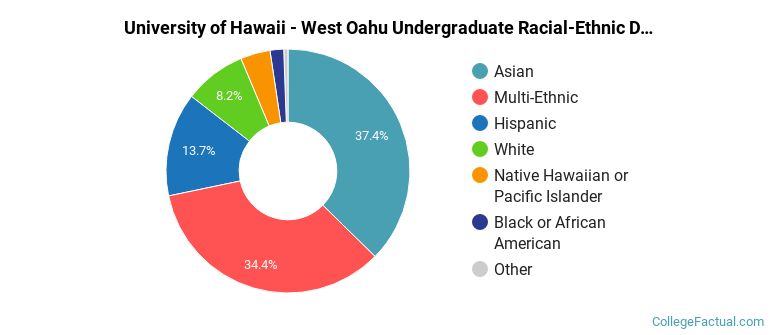
| Race/Ethnicity | Number |
|---|---|
| Asian | 1,207 |
| Multi-Ethnic | 1,033 |
| Hispanic | 433 |
| White | 282 |
| Native Hawaiian or Pacific Islander | 132 |
| Black or African American | 47 |
| International | 15 |
| Unknown | 9 |
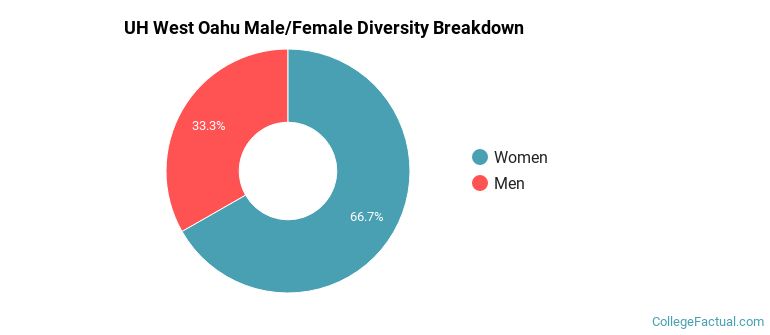
There are approximately 2,135 female students and 1,033 male students at UH West Oahu.
UH West Oahu ranks 1,382 out of 2,183 when it comes to geographic diversity.
4.11% of UH West Oahu students come from out of state, and 0% come from out of the country.
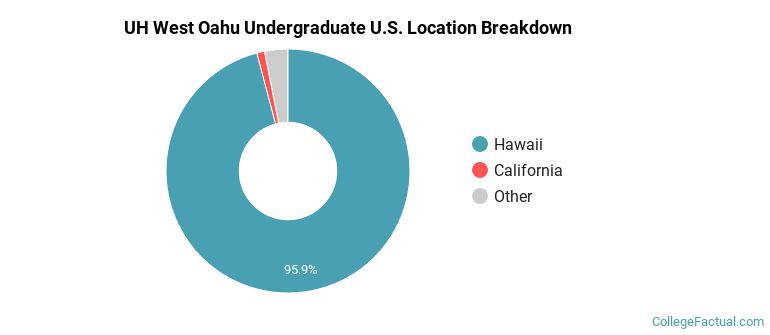
The undergraduate student body is split among 11 states (may include Washington D.C.). Click on the map for more detail.
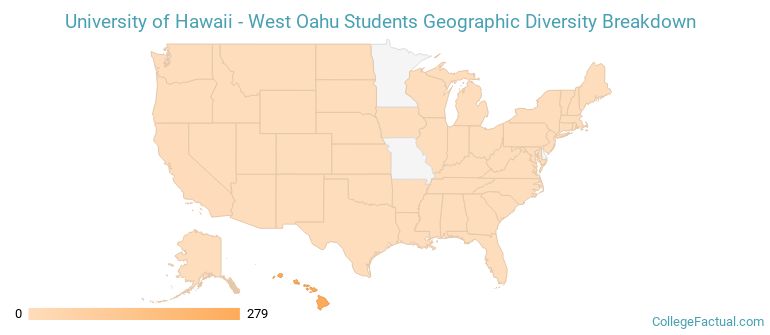
| State | Amount |
|---|---|
| Hawaii | 279 |
| California | 3 |
| Colorado | 1 |
| Georgia | 1 |
| Iowa | 1 |
Students from 7 countries are represented at this school, with the majority of the international students coming from Japan, South Korea, and China.
Learn more about international students at UH West Oahu.
A traditional college student is defined as being between the ages of 18-21. At UH West Oahu, 31.02% of students fall into that category, compared to the national average of 60%.
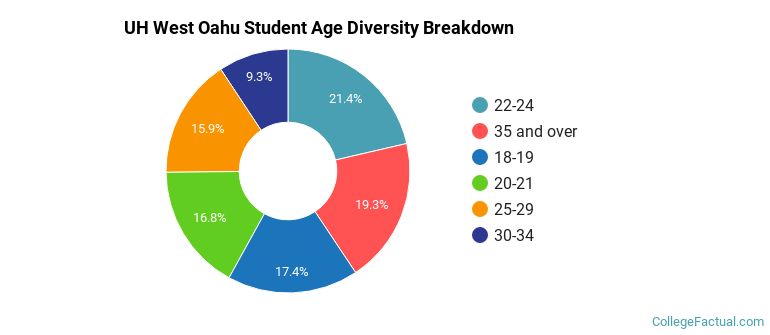
| Student Age Group | Amount |
|---|---|
| 22-24 | 598 |
| 35 and over | 539 |
| 18-19 | 486 |
| 20-21 | 470 |
| 25-29 | 444 |
| 30-34 | 260 |
| Under 18 | 0 |
Footnotes
*The racial-ethnic minorities count is calculated by taking the total number of students and subtracting white students, international students, and students whose race/ethnicity was unknown. This number is then divided by the total number of students at the school to obtain the racial-ethnic minorities percentage.
References
Department of Homeland Security Citizenship and Immigration Services
Image Credit: By Joel Bradshaw under License
Read College Factual's Diversity Ranking Methodology.