We've pulled together some essential information you should know about the program, including how many students graduate each year, the ethnic diversity of these students, and more. Also, learn how UH Clear Lake ranks among other schools offering degrees in public admin.
Go directly to any of the following sections:
The bachelor's program at UH Clear Lake was ranked #156 on College Factual's Best Schools for public admin list. It is also ranked #11 in Texas.
| Ranking Type | Rank |
|---|---|
| Best Public Administration Bachelor’s Degree Schools | 45 |
| Best Public Administration Schools | 156 |
During the 2021-2022 academic year, University of Houston - Clear Lake handed out 18 bachelor's degrees in public administration. Last year, the same number of degrees were handed out.
In 2022-2023, the average part-time undergraduate tuition at UH Clear Lake was $866 per credit hour for out-of-state students. The average for in-state students was $275 per credit hour. Information about average full-time undergraduate tuition and fees is shown in the table below.
| In State | Out of State | |
|---|---|---|
| Tuition | $6,600 | $20,784 |
| Fees | $1,722 | $1,722 |
| Books and Supplies | $1,026 | $1,026 |
| On Campus Room and Board | $11,014 | $11,014 |
| On Campus Other Expenses | $4,590 | $4,590 |
Learn more about UH Clear Lake tuition and fees.
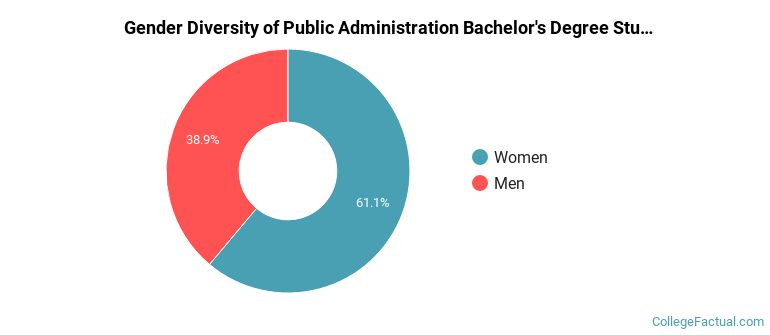
During the 2021-2022 academic year, 18 students graduated with a bachelor's degree in public admin from UH Clear Lake. About 39% were men and 61% were women.
The following table and chart show the ethnic background for students who recently graduated from University of Houston - Clear Lake with a bachelor's in public admin.
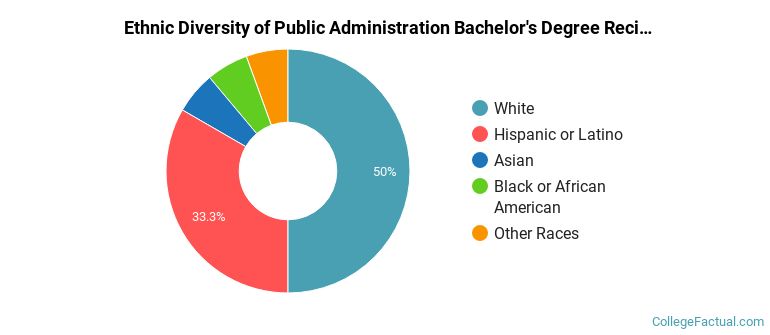
| Ethnic Background | Number of Students |
|---|---|
| Asian | 1 |
| Black or African American | 1 |
| Hispanic or Latino | 6 |
| White | 9 |
| Non-Resident Aliens | 0 |
| Other Races | 1 |
UH Clear Lake does not offer an online option for its public admin bachelor’s degree program at this time. To see if the school offers distance learning options in other areas, visit the UH Clear Lake Online Learning page.
Take a look at the following statistics related to the make-up of the public admin majors at University of Houston - Clear Lake.
More about our data sources and methodologies.