UH Downtown total enrollment is approximately 15,239 students. 6,865 are undergraduates and 132 are graduate students.
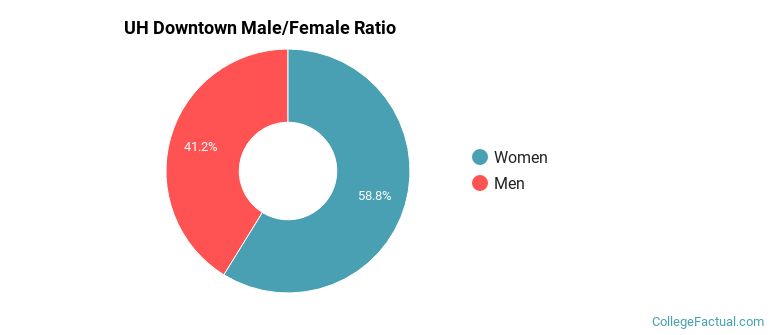
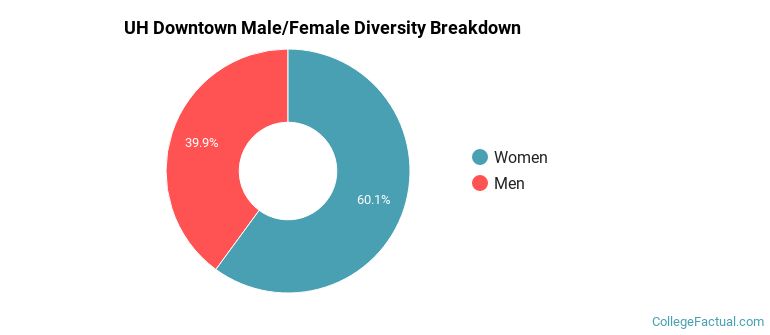
Male/Female Breakdown of Undergraduates
The full-time UH Downtown undergraduate population is made up of 62% women, and 38% men.
For the gender breakdown for all students, go here.
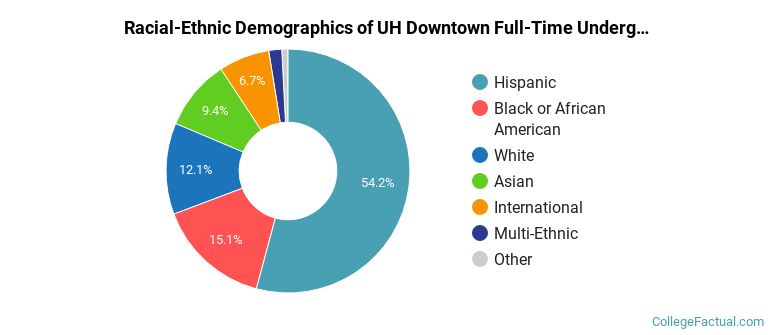
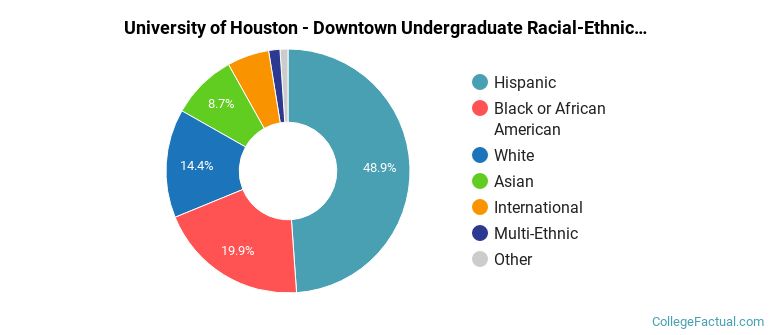
UH Downtown Racial/Ethnic Breakdown of Undergraduates
| Race/Ethnicity | Number |
|---|---|
| Hispanic | 3,880 |
| Black or African American | 1,088 |
| White | 833 |
| Asian | 653 |
| International | 213 |
| Multi-Ethnic | 146 |
| Unknown | 39 |
| Native Hawaiian or Pacific Islander | 4 |
See racial/ethnic breakdown for all students.
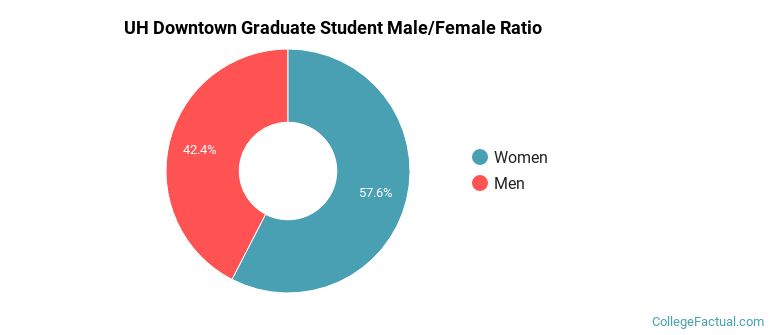
Male/Female Breakdown of Graduate Students
About 63% of full-time grad students are women, and 37% men.
For the gender breakdown for all students, go here.
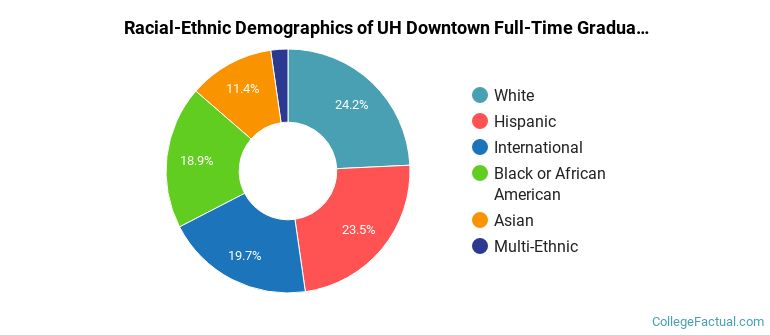
UH Downtown Racial-Ethnic Breakdown of Graduate Students
| Race/Ethnicity | Number |
|---|---|
| White | 32 |
| Black or African American | 31 |
| Hispanic | 30 |
| International | 17 |
| Asian | 16 |
| Multi-Ethnic | 6 |
| Native Hawaiian or Pacific Islander | 0 |
| Unknown | 0 |
See racial/ethnic breakdown for all students.
| Race/Ethnicity | Number |
|---|---|
| Hispanic | 7,984 |
| Black or African American | 2,992 |
| White | 2,085 |
| Asian | 1,349 |
| International | 355 |
| Multi-Ethnic | 337 |
| Unknown | 107 |
| Native Hawaiian or Pacific Islander | 12 |
There are approximately 9,499 female students and 5,740 male students at UH Downtown.
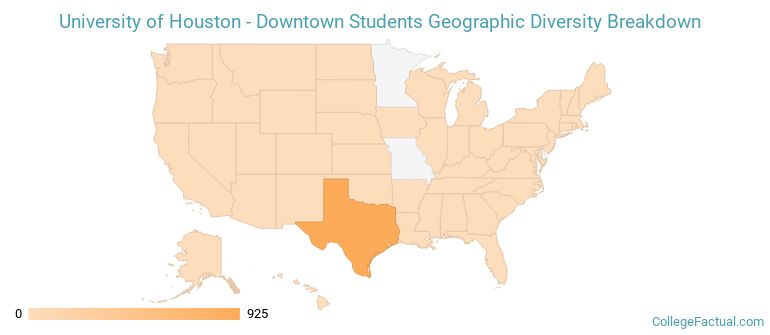
UH Downtown ranks 1,931 out of 2,183 when it comes to geographic diversity.
0.32% of UH Downtown students come from out of state, and 0.85% come from out of the country.
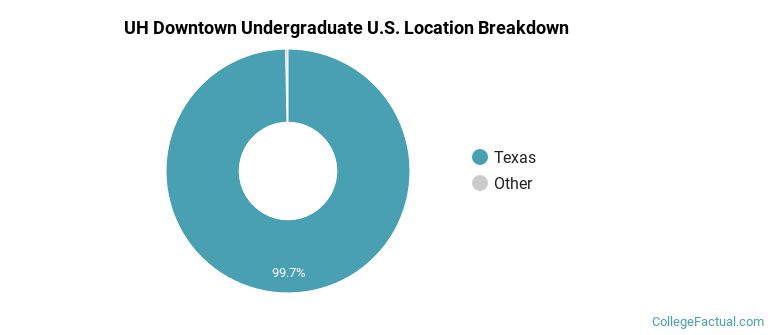
The undergraduate student body is split among 4 states (may include Washington D.C.). Click on the map for more detail.
| State | Amount |
|---|---|
| Texas | 925 |
| California | 1 |
| Kansas | 1 |
| New York | 1 |
| Alaska | 0 |
Students from 81 countries are represented at this school, with the majority of the international students coming from Vietnam, Angola, and China.
Learn more about international students at UH Downtown.
A traditional college student is defined as being between the ages of 18-21. At UH Downtown, 22.70% of students fall into that category, compared to the national average of 60%.
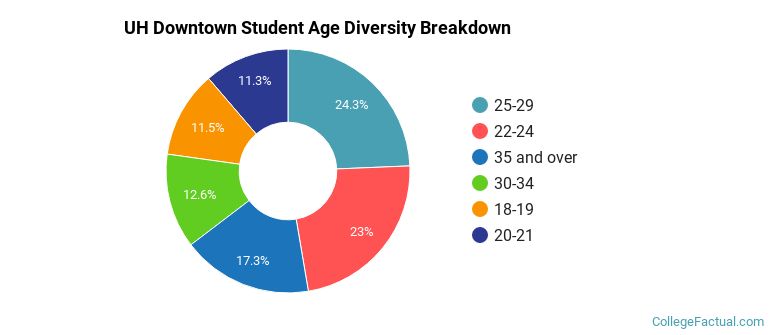
| Student Age Group | Amount |
|---|---|
| 25-29 | 3,373 |
| 22-24 | 3,187 |
| 35 and over | 2,402 |
| 30-34 | 1,741 |
| 18-19 | 1,594 |
| 20-21 | 1,565 |
| Under 18 | 0 |
Footnotes
*The racial-ethnic minorities count is calculated by taking the total number of students and subtracting white students, international students, and students whose race/ethnicity was unknown. This number is then divided by the total number of students at the school to obtain the racial-ethnic minorities percentage.
References
Department of Homeland Security Citizenship and Immigration Services
Find out how College Factual created their Diversity Rankings.